📝 产品详情
VectorBandsOnChart
| 作者 | Alberto Cejudo |
| 版本 | v2 |
| 激活数 | 5 |
| 原价 | $60 USD |
Background: Indicator On Chart based on my own oscillator ACe_Vector2016.
As you can appreciate, this indicator draws two bands on the chart in order to identify long and short opportunities.
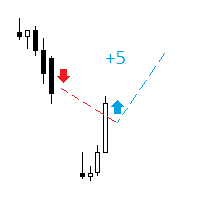
When the momentum vector oscillator (ACe_Vector2016) crosses the zero line, the indicator On Chart draws a long/short signal (green/red arrow).
Also you can identify the trend line on chart (MA): green colour if trend is moving up, and red colour if trend is moving down.
This indicator draw up and down non-symmetrical bands. If price goes up the lower band goes plain and the upper band connects max prices on bars. If price goes down, the indicator draws plain the upper band and connects lower prices on bars. I make this for a clean identification purposes only.
My recommendation for traders is to use both tools (indicator on chart and oscillator) for the cleanest identification of signals.
Indicator Parameters (try to use your own param):
- input int SPeriod=14; // Smoothing Period
- input ENUM_MA_METHOD SMethod=MODE_EMA; // Smoothing Method (you can choose one of the MA_Methods)
- input int nShift=10; // Shift bands & signals on chart (select the appropriate in order to see clean arrows on chart)
- extern int periodMA=10; //Moving Average period
- input ENUM_MA_METHOD methodMA=MODE_SMA; //Method:SMA,EMA,SMMA,LWMA
- input ENUM_APPLIED_PRICE price=PRICE_TYPICAL; //Desired Price for calculations
- input double nCoef=0.10; // Noise Coefficient for tuning purposes
Other Indicator parameters:
- Period - the number of bars used for the indicator calculations is 14, but you can select your own parameters.
- TimeFrame - the higher timeframe, from which the indicator values are taken is H1, but it runs fine using 30M too. It Must not be smaller than the timeframe of M15 the chart the indicator is running on.
- ShowEntries - to show entry points in history on the chart for visual analysis the indicator uses red/blue arrows on the historic chart.
- Symbol: you can use this indicator with Currencies (EURUSD, USDCAD,...) or Futures and CFDs. Adjust "nShift" to see clearly the entries (arrows)
安全须知
本产品仅通过 MQL5.com 官方渠道获取。其他渠道版本可能缺少完整功能和技术支持。
EA 配置
| 交易品种 | XAUUSD |
| 时间框架 | H1 (推荐) |
| 推荐经纪商 | IC Markets, IC Trading |
| 最低存款 | $300 / 0.01手 |
📸 截图预览