📝 产品详情
Kurtosis indicator
| 作者 | Vincent Albert Feugier |
| 版本 | v1.0 |
| 激活数 | 20 |
| 原价 | $35 USD |
What is Kurtosis?
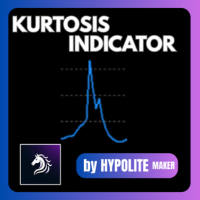
Kurtosis is a statistical indicator that measures the flatness of the price distribution over a given period. More precisely, it quantifies the importance of extreme price movements compared to a normal distribution. A normal distribution has a kurtosis of 3 — this is the red reference line on the indicator.
Formula
Kurtosis = m₄ / (m₂)²
Where m₂ is the variance of prices and m₄ is the 4th central moment. The more extreme price shocks occurred over the period, the larger the numerator m₄ becomes, and the higher the kurtosis rises.
How to read the indicator
The blue curve is the main value. It oscillates around level 3 (red dotted line). The grey horizontal levels (1, 5, 7, 9, 11) serve as visual reference points to gauge intensity. The real-time value is displayed directly at the tip of the blue curve.
When the curve rises above 3, the market has produced abnormally violent moves over the period. When it drops below 3, prices are moving in a uniform and calm fashion, without extremes.
Practical interpretation
Kurtosis above 3 — leptokurtic regime. The market has experienced sudden shocks, abnormally long candles. This is typical of economic announcements, session openings, or range breakouts. The risk of a violent move is high. Pay attention to position sizing.
Kurtosis equal to 3 — normal regime. Prices are behaving in an ordinary way. Neither too calm nor too explosive. Neutral regime.
Kurtosis below 3 — platykurtic regime. The market is consolidating, prices are moving in a regular and predictable manner. Little risk of surprise. Typical of ranging phases or low liquidity periods.
Key signal to watch
A kurtosis that sharply rebounds from a low level indicates that a violent move has just occurred or is forming. This is not a directional indicator — it does not tell you whether the market will go up or down — but it tells you how much the market is deviating from its normal behaviour.
Recommended settings on H1
For classic day trading on H1, period 50 is the best compromise. It covers approximately 2.5 days of candles, which is statistically sufficient to obtain a stable value without lagging too far behind events. Below 20, the signal becomes too erratic. Above 100, it reacts too slowly to be useful for intraday trading.
安全须知
本产品仅通过 MQL5.com 官方渠道获取。其他渠道版本可能缺少完整功能和技术支持。
EA 配置
| 交易品种 | XAUUSD |
| 时间框架 | H1 (推荐) |
| 推荐经纪商 | IC Markets, IC Trading |
| 最低存款 | $300 / 0.01手 |
📸 截图预览