📝 产品详情
Efficient Market Profile
| 作者 | Antonello Belgrano |
| 版本 | v1.20 |
| 激活数 | 5 |
| 原价 | $55 USD |
Professional Market Profile analysis directly on your MetaTrader 5 charts.
Efficient Market Profile allows traders to visualize market structure, fair value zones, and institutional price levels using the powerful Market Profile methodology.
The indicator automatically builds TPO-based profiles for each trading session, helping you quickly identify where the market spent the most time and where important price levels are forming.
All elements adjust dynamically to your chart, providing a clean, precise, and highly readable Market Profile visualization that stays perfectly aligned with price.
What Is Market Profile?Market Profile is a professional market analysis method developed by J. Peter Steidlmayer at the Chicago Board of Trade.
Instead of analyzing only price movement, Market Profile studies how much time the market spends at each price level, organizing activity into Time-Price Opportunities (TPOs).
This approach helps traders understand:
• Where the market considers fair value
• Where buyers and sellers agree or disagree
• Where institutional activity concentrates
• Where breakouts or reversals are more likely
Using Market Profile can help you:
✔ Identify high-probability support and resistance levels
✔ Detect fair value areas and price imbalances
✔ Understand market acceptance and rejection zones
✔ Spot breakout opportunities from balance areas
✔ Improve intraday and swing trading decisions
Efficient Market Profile provides these insights directly on your chart in real time.
Main FeaturesMulti-Session Market Profiles
Display multiple daily sessions simultaneously.
Previous sessions remain visible to easily compare value areas and market structure over time.
Accurate TPO Distribution
Each price level is assigned TPO letters (A–Z) representing time periods during the session.
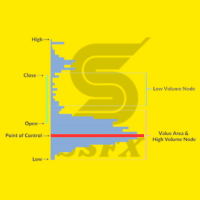
The price level with the highest TPO count becomes the Point of Control (POC) — the level where the market spent the most time.
Value Area Calculation
The indicator automatically calculates the Value Area, which typically contains 70% of the session’s trading activity.
Displayed levels include:
• VAH – Value Area High
• VAL – Value Area Low
• POC – Point of Control
These levels are clearly displayed with lines and labels.
Initial Balance
The Initial Balance (IB) represents the range formed during the first trading period of the session.
The indicator highlights:
• IB High and IB Low
• The Initial Balance range directly on the chart
This level is widely used by professional traders as a key intraday reference.
Single Prints Detection
Price levels touched by only one TPO period are automatically highlighted.
These Single Prints often represent fast directional moves and can later act as support or resistance zones.
Session Statistics Panel
An optional on-chart panel shows the most important session levels:
• POC
• VAH / VAL
• Session High / Low
• Initial Balance High / Low
• Initial Balance Range
This allows traders to monitor key levels at a glance.
Customization OptionsEfficient Market Profile offers full visual customization:
• TPO colors (Value Area / Outside Value / POC / Single Prints)
• Value Area background shading
• Initial Balance background shading
• POC line color and style
• VAH / VAL line colors
• Adjustable profile width
• Toggle TPO letter display
• Show or hide individual levels
You can easily adapt the indicator to any chart style or trading workflow.
安全须知
本产品仅通过 MQL5.com 官方渠道获取。其他渠道版本可能缺少完整功能和技术支持。
EA 配置
| 交易品种 | XAUUSD |
| 时间框架 | H1 (推荐) |
| 推荐经纪商 | IC Markets, IC Trading |
| 最低存款 | $300 / 0.01手 |
📸 截图预览