📝 产品详情
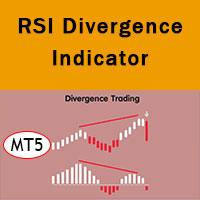
RSI Divergence Indicator MT5
| 作者 | Amir Atif |
| 版本 | v3.5 |
| 更新 | 2022-05-26T10:00:12 |
| 激活数 | 0 |
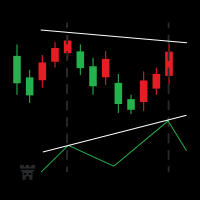
RSI divergence indicator finds divergences between price chart and RSI indicator and informs you with alerts (popup, mobile notification or email). Its main use is to find trend reversals in the chart.
Always use the divergence indicators with other technical assets like support resistance zones, candlestick patterns and price action to have a higher possibility to find trend reversals.
Three confirmation type for RSI divergences:
- RSI line cross 50 level
- Price returns to previous H/L
- Creating a new ZigZag leg in price chart
- No Confirmation (Immediate Alert): it repaints and deletes the signal if it invalidated
When divergence is confirmed, the indicator draws an arrow on the chart (not for the new ZigZag leg confirmation type).
This indicator uses ZigZag indicator to determine trend direction and HH/LL of the price, you can change the ZigZag parameters in the indicator's input window. You can add the ZigZag Indicator to your chart template to have a better look of painted divergences.
- You can set the indicator to alert only when RSI divergence occurs in the overbought/oversold levels.
- The indicator has four buffers that you can use in your EA, "RSI" buffer shows the RSI value ,"Divergence Type" Buffer shows "1" for bullish divergences and "-1" for bearish divergences and other buffers show the start and end positions of divergence line . You can check them out in the "Data Window" (Ctrl+D).
安全须知
本产品仅通过 MQL5.com 官方渠道获取。其他渠道版本可能缺少完整功能和技术支持。
EA 配置
| 交易品种 | XAUUSD |
| 时间框架 | H1 (推荐) |
| 推荐经纪商 | IC Markets, IC Trading |
| 最低存款 | $300 / 0.01手 |
📸 截图预览