📝 产品详情
LS Yield Histogram Pair Trading
| 作者 | Thiago Lopes |
| 版本 | v4 |
| 更新 | 17 三月 2026 |
| 激活数 | 5 |
| 原价 | $30 USD |
Caicai L&S Yield Histogram
Important Notice: This indicator is an integral tool of the automated EA Caicai Long and Short Pair Trading.
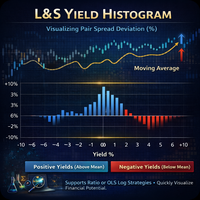
This indicator visually displays the percentage deviation (Yield %) of a pair's current spread relative to its own historical mean. It is an excellent tool for quickly visualizing the gross financial potential of a market distortion in Long & Short operations.
Main Features:
- Percentage Visualization: Understand the size of the distortion in palpable percentage terms.
- Multiple Strategies: Supports spread calculations based on Simple Ratio or Ordinary Least Squares (OLS) Log.
- Dynamic Coloring: Automatically colors the histogram bars for instant visual feedback.
Input Parameters:
- InpSymbolY: The ticker of the first asset. Ex: EURUSD
- InpSymbolX: The ticker of the second asset. Ex: GBPUSD
- InpStrategy: Calculation method. Choose between 0 (Simple Ratio) or 1 (OLS Log).
- InpPeriod: The historical period used to calculate the mean and the current yield deviation (Default: 20).
How to Use:
The histogram plots the Yield %. Blue bars indicate that the current spread is above the historical mean (potential short spread opportunity), while red bars indicate the spread is below the mean (potential long spread opportunity). The height of the bar shows the exact percentage deviation.
安全须知
本产品仅通过 MQL5.com 官方渠道获取。其他渠道版本可能缺少完整功能和技术支持。
EA 配置
| 交易品种 | XAUUSD |
| 时间框架 | H1 (推荐) |
| 推荐经纪商 | IC Markets, IC Trading |
| 最低存款 | $300 / 0.01手 |
📸 截图预览