📝 产品详情
Trade Journal and Dashboard
| 作者 | Minh Vuong Pham |
| 版本 | v1.30 |
| 更新 | 2026-02-28T08:18:31 |
| 激活数 | 10 |
| 原价 | $30 USD |
Real-Time Performance Analytics & Trade Journal on Your Chart
What Is It?
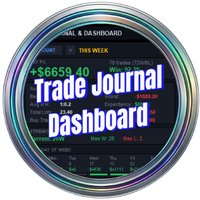
Trade Journal & Dashboard is an on-chart analytics panel that automatically tracks every closed trade and calculates professional performance metrics in real time. No spreadsheets, no external apps — everything you need to evaluate your trading performance lives directly on your MT5 chart.
It reads your trade history, computes win rate, profit factor, expectancy, drawdown, streaks, and more — updated every second.
Support: https://www.mql5.com/en/channels/vuongphamtrading
Dashboard Metrics
Hero Section
- Net P/L — total profit/loss for the selected period (large, color-coded)
- Trade Count — total trades with Win/Loss breakdown
- Win Rate % — percentage of winning trades
- Profit Factor — gross profit / gross loss (>1.0 = profitable system)
Key Metrics Grid
| Left Column | Right Column |
|---|---|
| Avg Win ($) | Avg Loss ($) |
| Best Trade ($) | Worst Trade ($) |
| Avg R:R Ratio | Expectancy ($/trade) |
| Total Lots Traded | Max Drawdown ($) |
| Buy Trades (P/L) | Sell Trades (P/L) |
Streaks
- Current streak (e.g., "3W" or "2L")
- Max consecutive wins
- Max consecutive losses
P/L by Day of Week
Visual breakdown showing trade count and P/L for each day (Mon–Sun). Instantly see which days are profitable and which are bleeding money.
Open Positions Monitor
- Live position count with Buy/Sell breakdown
- Unrealized P/L (updates on every tick)
- Lots and P/L per direction
Account Summary
Balance, Equity, Free Margin, Drawdown %
Time Period Selector
Click < > arrows to cycle through periods:
- Today — trades closed today
- This Week — Monday to now
- This Month — 1st of month to now
- Last 7 Days — rolling 7-day window
- Last 30 Days — rolling 30-day window
- All Time — entire account history
Click the scope button to toggle between Current Symbol and Entire Account.
Key Formulas
Win Rate = Wins / Total Trades × 100
Profit Factor = Gross Profit / Gross Loss
- PF > 1.5 = Good | PF > 2.0 = Excellent | PF < 1.0 = Losing
Expectancy = (Win% × Avg Win) - (Loss% × Avg Loss)
- Positive = profitable system over time
- This is the single most important metric for any trading strategy
Risk-to-Reward = Avg Win / Avg Loss
- R:R > 1.5 with 40%+ win rate = solid strategy
- R:R > 2.0 with 35%+ win rate = excellent strategy
CSV Export
Click EXPORT CSV REPORT to generate a detailed CSV file containing:
- Every closed trade: ticket, symbol, type, volume, price, time, profit, swap, commission
- Summary section: all calculated metrics
Files are saved to: MQL5/Files/TradeJournal/
Auto-export option available (exports once daily at reset hour).
Input Parameters
General
| Parameter | Description |
|---|---|
| Scope | Current Symbol or Entire Account |
| DisplayPeriod | Starting period (Today/Week/Month/etc.) |
| FilterMagic | Filter by Magic Number (0 = all EAs) |
| IncludeSwapCommission | Include swap & commission in calculations |
| DailyResetHour | When "Today" starts (server time) |
Display
| Parameter | Description |
|---|---|
| PanelX / PanelY | Panel position on chart |
| PanelWidth | Panel width (default: 340) |
| Colors | Fully customizable (background, text, profit, loss) |
Export
| Parameter | Description |
|---|---|
| EnableAutoExport | Auto-export CSV daily |
| ExportPath | Export folder name |
Installation
- Copy TradeJournal_Dashboard_v1.mq5 → MQL5/Experts/
- Restart MT5 → drag onto any chart
- Configure scope and period → OK
- Dashboard appears immediately with your trade history
Note: The EA does not place or manage any trades. It is purely an analytics/monitoring tool. Safe to run alongside any other EA.
Use Cases
Daily Review — Set period to "Today", review win rate and P/L after each session. Export CSV for your trading journal spreadsheet.
Weekly Analysis — Switch to "This Week" to spot patterns. Check which day-of-week performs best/worst.
Strategy Evaluation — Use Magic Number filter to analyze individual EA performance. Compare profit factors across strategies.
Prop Firm Tracking — Monitor daily P/L, drawdown, and win rate to stay within challenge rules.
Psychology Check — Watch your streak counter. If you're on a 4+ loss streak, it might be time to step away.
Complete Trading Toolkit (5 EAs)
| Tool | Role |
|---|---|
| OneClick Trade Panel | Fast entry + risk calculator |
| Collective TP Manager | Collective profit target |
| Trailing Stop Manager | Auto-protect profits |
| Daily P/L Limiter | Daily risk control |
| Trade Journal Dashboard | Performance analytics |
Entry → Management → Protection → Risk Control → Analysis
This EA is a monitoring tool only. It does not execute trades. Always test on demo first.
安全须知
本产品仅通过 MQL5.com 官方渠道获取。其他渠道版本可能缺少完整功能和技术支持。
EA 配置
| 交易品种 | XAUUSD |
| 时间框架 | H1 (推荐) |
| 推荐经纪商 | IC Markets, IC Trading |
| 最低存款 | $300 / 0.01手 |
📸 截图预览