📝 产品详情
Institutional Trader Pro
| 作者 | Emma-ekong Ben Eshiet |
| 版本 | v2 |
| 激活数 | 20 |
| 原价 | $35 USD |
N/B: All our product purchase comes with our free ‘’DAILY SCALPER EA’’
Whatsapp Developer for yours after successful purchase.
Institutional Trader Pro - Professional Analysis
Institutional-Grade Market Intelligence Platform
This indicator represents a sophisticated market surveillance system engineered to identify high-probability trading opportunities across multiple instruments simultaneously. Its institutional designation derives from three core characteristics:
1. Institutional Scanning Methodology
· Multi-Asset Surveillance: Concurrent analysis of 30+ financial instruments
· Algorithmic Pattern Recognition: Proprietary signal detection leveraging price action, volume dynamics, and momentum indicators
· Probability-Weighted Scoring: Quantitative strength assessment for each identified opportunity
2. Professional Workflow Integration
· Top-5 Signal Prioritization: Institutional portfolio managers focus on highest-conviction ideas only
· Complete Trade Architecture: Each signal includes precise entry, stop-loss, and take-profit parameters
· Visual Trade Mapping: Professional-grade chart annotations for rapid execution planning
3. Risk-Managed Execution Framework
· ATR-Based Position Sizing: Volatility-adjusted stop-loss calculations
· Defined Risk-Reward Ratios: 1:2 minimum reward-to-risk structure
· Time-Decay Signal Validation: Automatic signal expiration after 2 hours
---
Market Analysis Engine Components
Quantitative Signal Generation
The platform employs a multi-factor scoring model:
1. Price Momentum Analysis
· Directional bias assessment
· Trend confirmation protocols
· Breakout/breakdown detection
2. Volume Profile Validation
· Abnormal volume spike identification
· Institutional accumulation/distribution patterns
· Volume-price divergence analysis
3. Technical Indicator Convergence
· RSI oversold/overbought positioning
· MACD momentum alignment
· Multi-timeframe trend confirmation
Institutional-Grade Filtering
· Minimum Strength Threshold: Signals require quantitative confirmation
· Cross-Verification: Multiple independent confirmation sources
· Liquidity Validation: Spread analysis for execution feasibility
---
Professional Interface Architecture
Executive Dashboard
· Real-Time Status Monitoring: System operational status
· Scan Progress Metrics: Completion percentages and throughput
· Historical Performance Tracking: Last scan timestamps and results
Signal Management Matrix
```
INSTRUMENT TIMEFRAME DIRECTION ENTRY STOP TARGET CONFIDENCE
EURUSD H1 LONG 1.08500 1.08350 1.08650 ★★★★☆
GBPUSD H4 SHORT 1.26500 1.26800 1.26200 ★★★☆☆
```
· Color-Coded Direction: Immediate visual classification
· Precision Pricing: 5-decimal institutional pricing
· Confidence Grading: Quantitative strength assessment
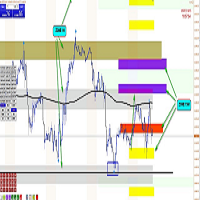
Visual Trade Planning
· Entry Line (Blue): Proposed execution level
· Risk Line (Red): Maximum acceptable drawdown
· Target Line (Green): Profit-taking objective
---
Institutional Application Scenarios
Portfolio Manager Utilization
· Opportunity Identification: Rapid screening for alpha generation
· Risk-Adjusted Selection: Focus on highest probability setups
· Execution Preparation: Pre-trade planning and sizing
Proprietary Trading Desk
· Multi-Asset Coverage: Cross-market opportunity detection
· Systematic Scanning: Eliminating manual chart review
· Standardized Evaluation: Consistent opportunity assessment
Risk Management Integration
· Pre-Trade Risk Assessment: Stop-loss calculations before execution
· Position Sizing Guidance: Volatility-based allocation recommendations
· Portfolio Correlation Analysis: Multiple instrument consideration
---
Key Differentiators from Retail Tools
Professional Feature Set
1. Concurrent Multi-Asset Analysis: True institutional scanning capability
2. Quantitative Signal Scoring: Probability-based opportunity ranking
3. Complete Trade Architecture: End-to-end trade planning
4. Professional Visualization: Institutional-standard chart annotations
Risk Management Sophistication
· Volatility-Adjusted Stops: ATR-based position sizing
· Time-Decay Signal Validity: Market condition responsiveness
· Strength-Based Filtering: Minimum conviction requirements
Workflow Integration
· Rapid Market Review: Seconds versus manual hours
· Standardized Evaluation: Consistent opportunity assessment
· Execution-Ready Outputs: Complete trade parameters
---
Operational Value Proposition
This platform delivers institutional-grade market surveillance by:
1. Automating Opportunity Identification: Replacing manual chart review
2. Quantifying Signal Quality: Objective strength assessment
3. Providing Complete Trade Architecture: Execution-ready recommendations
4. Supporting Risk-Managed Decisions: ATR-based position sizing
The "Institutional" designation reflects its capacity to process market data, identify opportunities, and provide execution-ready trade architecture at a scale and sophistication typically reserved for professional trading operations. It represents a systematic approach to market analysis that prioritizes quantitative assessment, risk management, and professional workflow integration over discretionary interpretation.
Trade Signal Core Logic - Simple Breakdown
The Basic Question It Answers:
"Should we buy or sell right now, and how confident are we?"
---
5-Point Checklist (All Must Agree)
The indicator runs through this simple checklist:
1. Price Check → "Is it moving?"
· BUY if: Price higher than yesterday's close
· SELL if: Price lower than yesterday's close
· Score: +1 point for correct direction
2. Volume Check → "Are people interested?"
· Looks at: Trading volume compared to normal
· BUY if: Higher volume AND price moving up
· SELL if: Higher volume AND price moving down
· Score: +2 points for volume confirmation
3. RSI Check → "Is it cheap or expensive?"
· RSI Below 40 = "Oversold" (cheap) → BUY (+2 points)
· RSI Above 60 = "Overbought" (expensive) → SELL (+2 points)
4. MACD Check → "What's the momentum?"
· BUY if: Fast line above slow line (+1.5 points)
· SELL if: Fast line below slow line (+1.5 points)
5. Trend Check → "What's the bigger picture?"
· BUY if: Price has been going up for 3 days (+1 point)
· SELL if: Price has been going down for 3 days (+1 point)
---
Simple Scoring System
Minimum to get a signal: 2.5 points (like getting a C+ grade)
Example Trade Signal:
```
EURUSD Analysis:
1. Price moved UP (+1 point)
2. Volume was HIGH (+2 points)
3. RSI at 38 (cheap) (+2 points)
4. MACD showing UP (+1.5 points)
5. In an UPTREND (+1 point)
TOTAL: 7.5 points → STRONG BUY SIGNAL
```
---
What Makes It "Smart"
3-Layer Confirmation:
1. Price is moving (action)
2. Volume agrees (interest)
3. Indicators confirm (momentum)
Think of it like: Getting 3 different doctors to agree on a diagnosis before surgery.
Automatic Risk Management:
1. Stop Loss = Entry price minus (ATR × 1.5)
· ATR = Average True Range (how much it usually moves)
· Example: If EURUSD usually moves 10 pips/day → Stop Loss = 15 pips away
2. Take Profit = 2× the risk
· If risking 15 pips → Target = 30 pips profit
· 2:1 Reward/Risk ratio (standard professional target)
---
What Actually Happens When You Click "SCAN"
Step-by-Step:
1. Looks at 30 different currency pairs
2. For EACH pair, runs the 5-point checklist
3. Gives each a score (like grading a test)
4. Picks the TOP 5 highest scores
5. Shows them in the table with entry/stop/target prices
---
Real Example (Super Simple):
Looking at GBPUSD right now:
· Current price: 1.2650
· Yesterday's close: 1.2640
· Volume: High
· RSI: 65 (expensive)
· MACD: Fast line below slow
· Trend: Going down
Scoring:
1. Price DOWN ✓ (+1)
2. High volume with DOWN price ✓ (+2)
3. RSI overbought ✓ (+2)
4. MACD bearish ✓ (+1.5)
5. Downtrend ✓ (+1)
TOTAL: 7.5 points → SELL SIGNAL
Trade Setup:
· SELL at: 1.2650
· Stop Loss: 1.2680 (30 pips risk)
· Take Profit: 1.2620 (30 pips profit) → 1:1 ratio
---
The "Secret Sauce" - Why It Works
3 Key Principles:
1. Multiple Confirmations → Don't trust just one sign
2. Strength Scoring → Some signs are more important than others
3. Risk First → Know your stop BEFORE you enter
Simple Analogy:
It's like having 5 weather forecasts:
· Weatherman 1 says: Rain (1 point)
· Weatherman 2 says: Heavy rain (2 points)
· Radar shows: Storm clouds (2 points)
· Barometer dropping: (1.5 points)
· Trend: Been raining all week (1 point)
Total: 7.5 points → Take your umbrella!
---
Bottom Line - What This Indicator Does:
1. Asks 5 simple questions about each currency
2. Grades the answers (1-10 points)
3. Shows you the best 5 opportunities
4. Tells you exactly where to:
· Enter the trade
· Place your stop
· Take your profit
5. Updates automatically as market conditions change
No magic, no predictions - just systematic checking of what's actually happening right now.
安全须知
本产品仅通过 MQL5.com 官方渠道获取。其他渠道版本可能缺少完整功能和技术支持。
EA 配置
| 交易品种 | XAUUSD |
| 时间框架 | H1 (推荐) |
| 推荐经纪商 | IC Markets, IC Trading |
| 最低存款 | $300 / 0.01手 |
📸 截图预览