📝 产品详情
Institutional Dashboard Ultimate
| 作者 | Dominik |
| 版本 | v1 |
| 激活数 | 10 |
| 原价 | $74 USD |
Overview
A professional-grade trading analytics dashboard for MetaTrader 5 that combines **institutional-level risk metrics** with **retail trading statistics**. Features real-time equity curve visualization, drawdown analysis, and comprehensive performance breakdowns.
---
## Features
### ? Institutional Metrics
| Metric | Description |
|--------|-------------|
| **Sharpe Ratio** | Risk-adjusted return measurement (excess return per unit of volatility) |
| **Sortino Ratio** | Downside risk-adjusted return (penalizes only negative volatility) |
| **Calmar Ratio** | Annual return divided by maximum drawdown |
| **Recovery Factor** | Net profit divided by maximum drawdown |
| **VaR (95%/99%)** | Value at Risk - potential loss at confidence level |
| **CVaR/ES** | Conditional VaR - expected shortfall beyond VaR threshold |
| **Ulcer Index** | Measures depth and duration of drawdowns |
### ? Retail Metrics
| Metric | Description |
|--------|-------------|
| **Win Rate** | Percentage of winning trades |
| **Profit Factor** | Gross profit divided by gross loss |
| **Expectancy** | Average expected profit per trade |
| **RRR** | Risk-Reward Ratio (average win / average loss) |
| **Avg Win/Loss** | Average profit and loss per trade |
| **Max Consecutive** | Longest winning and losing streaks |
### ? Visualizations
- **Equity Curve** - Color-coded profit/loss trajectory
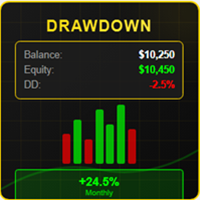
- **Drawdown Chart** - Real-time drawdown analysis with filled area
- **Symbol Performance** - Bar chart breakdown by trading pair
- **Win/Loss Distribution** - Donut chart with percentages
### ⚙️ UI Features
- **Dark/Light Theme** - Toggle with single click
- **Draggable Panel** - Position anywhere on chart
- **Minimize/Maximize** - Collapse to header bar
- **Auto-Refresh** - Configurable update interval
- **Black Chart Mode** - Hide candles for focused analysis
- **Scalable Fonts** - Adjust text size (8-16pt)
---
## Installation
1. Copy `InstitutionalDashboard.mq5` to:
```
MQL5/Indicators/
```
2. Restart MetaTrader 5 or refresh Navigator
3. Drag indicator onto any chart
4. Configure inputs as needed
---
## Input Parameters
### Filter Settings
| Parameter | Default | Description |
|-----------|---------|-------------|
| `Symbol Filter` | (empty) | Filter by specific symbol (e.g., "EURUSD") |
| `Magic Number Filter` | 0 | Filter by EA magic number (0 = all) |
| `EA Comment Filter` | (empty) | Filter by trade comment (partial match) |
### Time Period
| Parameter | Default | Description |
|-----------|---------|-------------|
| `Analysis Time Period` | All History | Today/Week/Month/Quarter/Year/All/Custom |
| `Custom Start Date` | 0 | Start date for custom period (0 = auto) |
| `Custom End Date` | 0 | End date for custom period (0 = current) |
### Display Settings
| Parameter | Default | Description |
|-----------|---------|-------------|
| `Color Theme` | Dark Mode | Dark or Light theme |
| `Panel X Position` | 50 | Horizontal position in pixels |
| `Panel Y Position` | 50 | Vertical position in pixels |
| `Panel Width` | 1200 | Dashboard width in pixels |
| `Panel Height` | 750 | Dashboard height in pixels |
| `Base Font Size` | 10 | Font size scaling (8-16) |
| `Panel Opacity` | 245 | Transparency level (0-255) |
| `Show Chart Visualizations` | true | Display equity/drawdown charts |
| `Auto-Refresh Interval` | 3 | Update frequency in seconds |
| `Keep Panel on Top` | true | Always display above other objects |
| `Set Chart Background to Black` | true | Hide chart candles/grid |
### Metrics Settings
| Parameter | Default | Description |
|-----------|---------|-------------|
| `Risk-Free Rate` | 0.04 | Annual risk-free rate for Sharpe calculation |
| `VaR Confidence Level` | 0.95 | Confidence level for VaR (0.90-0.99) |
| `Minimum Trades for Statistics` | 10 | Required trades before calculating ratios |
---
## Button Controls
| Button | Function |
|--------|----------|
| **L/D** | Toggle Light/Dark theme |
| **R** | Manual refresh |
| **−/+** | Minimize/Maximize panel |
| **X** | Close dashboard |
*Drag the header bar to reposition the panel*
---
## Color Coding
| Color | Meaning |
|-------|---------|
| ? Green | Profitable / Good performance |
| ? Red | Loss / Poor performance |
| ? Yellow | Neutral / Warning |
| ? Blue | Accent / Information |
| ⚪ Gray | Muted / Secondary text |
---
## Metric Thresholds
### Performance Indicators
| Metric | Good | Neutral | Poor |
|--------|------|---------|------|
| Sharpe Ratio | ≥ 1.0 | 0 - 1.0 | < 0 |
| Sortino Ratio | ≥ 1.5 | 0 - 1.5 | < 0 |
| Calmar Ratio | ≥ 1.0 | < 1.0 | - |
| Win Rate | ≥ 50% | - | < 50% |
| Profit Factor | ≥ 1.5 | 1.0 - 1.5 | < 1.0 |
| Recovery Factor | ≥ 3.0 | < 3.0 | - |
| Ulcer Index | ≤ 5.0 | - | > 5.0 |
---
## Technical Notes
- Uses MQL5 Canvas library for rendering
- History data accessed via HistorySelect()
- Chart colors automatically restored on removal
- Memory properly cleaned in OnDeinit()
- Supports all account currencies
---
## Version History
| Version | Changes |
|---------|---------|
| 2.2 | Added font size input, English documentation |
| 2.1 | Fixed text rendering, added theme tracking |
| 2.0 | Black chart mode, optimized code |
| 1.0 | Initial release
安全须知
本产品仅通过 MQL5.com 官方渠道获取。其他渠道版本可能缺少完整功能和技术支持。
EA 配置
| 交易品种 | XAUUSD |
| 时间框架 | H1 (推荐) |
| 推荐经纪商 | IC Markets, IC Trading |
| 最低存款 | $300 / 0.01手 |
📸 截图预览