📝 产品详情
MTF Connecting Fractals
| 作者 | Ebrah Ssali |
| 版本 | v1 |
| 激活数 | 5 |
MTF Connecting Fractals
Multi-Timeframe Market Structure. One Glance. Real Decisions.
MTF Connecting Fractals is not just another arrow-printing indicator. It’s a complete multi-timeframe market structure intelligence system designed to answer the most important trading questions in real time - clearly, visually, and without clutter.
Built around fractals as objective structure anchors, this tool gives traders a decisive edge by combining price action, structural context, proximity risk, and multi-TF confluence into one coherent decision framework.
What Problem Does It Solve?
Most traders struggle with:
• “Is this level meaningful or noise?”
• “Is price breaking out or just testing?”
• “Am I buying into resistance?”
• “Do higher timeframes agree with my entry?”
• “Where should my stop and target logically go?”
MTF Fractals answers all of these - instantly.
Core Functionality (How It Thinks)
1. Fractal-Based Structural Levels
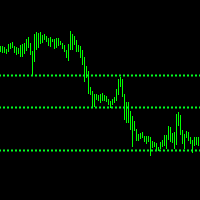
The indicator automatically detects and maintains dynamic support and resistance using fractal logic:
• Levels persist until decisively invalidated (and you get to know when they are, instantly)
• Sensitivity filtering avoids micro-noise
• Level age is tracked to distinguish fresh vs established structure
This means you’re trading real structure, not repainting guesses.
2. Multi-Timeframe Structural Intelligence
Up to 6 timeframes simultaneously (from M5 to D1):
• Each timeframe independently analyzes:
o Support & resistance
o Breakout vs range behavior
o Proximity risk
o Active signals
• Results are unified into a live dashboard
You no longer have to flip charts - context is always visible.
3. Smart Signal Logic (Not Just Arrows)
Buy and Sell arrows are triggered only when price interacts meaningfully with fractal structure:
• Break-and-hold above resistance → BUY
• Rejection or failure → SELL
• Optional duplicate-signal suppression avoids overtrading
Each arrow represents structure + price confirmation, not blind momentum.
Confluence Engine (Where the Edge Lives)
The dashboard aggregates multiple weighted factors into actionable confidence:
Key Confluences Used
• Multi-TF signal alignment
• Structural state agreement (breakout / testing / range)
• Level age (mature levels = stronger reactions)
• Proximity risk (distance to nearest S/R)
• Heat-map distribution across time frames
These are distilled into:
• Confluence %
• Structure Alignment State
• Risk Classification
• Clear Trade Recommendation
Signal Hierarchy (Confidence Ladder)
Not all signals are equal. The indicator implicitly ranks them:
Highest Confidence
1. Multi-TF breakout alignment (≥60% TFs)
2. Fresh signal + SAFE proximity
3. Strong confluence score (≥60%)
4. Minimal risk classification
Medium Confidence
• Partial TF alignment
• Testing structure with low risk
• Signals near but not at danger zones
Low Confidence / Avoid
• Conflicting breakout directions
• High proximity (DANGER / WARNING)
• Low confluence (<30%)
This hierarchy prevents impulsive trades and keeps you trading only when structure agrees.
Built-In Risk Awareness (Not Afterthoughts)
Risk is evaluated before you trade, not after:
Proximity System
• DANGER (<5 pips) – stop hunts & reversals likely
• WARNING (5–10 pips) – reduced R:R
• CAUTION (10–20 pips) – manageable
• SAFE (>20 pips) – clean execution zone
Stop-Loss Guidance
• Logical SL placement = beyond nearest fractal level
• Level age helps judge how much room price may need
Take-Profit Logic
• Targets naturally align with:
o Opposing fractal levels (place tp just before the Fractal connecting line)
o Higher-TF structure boundaries
o Breakout continuation zones
You’re no longer guessing exits - structure defines them.
Dashboard = Decision Engine
The visual dashboard transforms raw data into trading intelligence:
• Structure column → What is price doing?
• Age → How strong is this level?
• Proximity → Is this trade safe right now?
• Signal → Directional bias
• Heatmap → Where risk or opportunity clusters
• Recommendation bar → Plain-English action guidance
This answers “What? When? Why?” at a glance.
Minimal Setup, Maximum Output
Despite its mathematical depth, configuration is intentionally simple:
• Fractal sensitivity
• Duplicate signal toggle
• Time frame selection
• Dashboard on/off
No parameter optimization loops.
No indicator stacking.
It adapts automatically to market conditions.
EA-Ready by Design
Buy and Sell arrows are stored in dedicated indicator buffers:
• BufBuy[]
• BufSell[]
This makes the indicator automation-ready:
• Easily accessed via iCustom
• Clean signal logic for EAs
• No object scraping required
• Supports discretionary → semi-auto → full-auto workflows
You can prototype manually, then scale with confidence.
Who is this for?
• Discretionary traders who want context, not clutter
• Structure traders who value levels over indicators
• Algorithmic traders needing clean, deterministic signals
• Scalpers, day traders, and swing traders alike
Bottom Line
MTF Connecting Fractals doesn’t just tell you when to trade.
It tells you:
• If you should trade
• How strong the idea is
• What the risk really looks like
• Where structure supports or invalidates you
It turns market noise into structured, actionable decisions - and that’s the real edge.
安全须知
本产品仅通过 MQL5.com 官方渠道获取。其他渠道版本可能缺少完整功能和技术支持。
EA 配置
| 交易品种 | XAUUSD |
| 时间框架 | H1 (推荐) |
| 推荐经纪商 | IC Markets, IC Trading |
| 最低存款 | $300 / 0.01手 |
📸 截图预览