📝 产品详情
The Daily Volume Profile
| 作者 | Adrian Berisha |
| 版本 | v4 |
| 激活数 | 20 |
| 原价 | $30 USD |
Daily Volume Profile - See Where Smart Money Trades
Stop guessing support and resistance. Start seeing where REAL volume is.
The Daily Volume Profile indicator reveals the hidden structure of the market by showing exactly where trading activity concentrates at each price level. While most traders use lagging indicators, you'll see where institutional money positions itself - BEFORE the move happens.
What You Get:
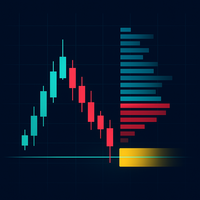
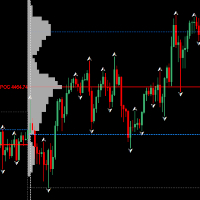
→ POC (Point of Control) - The most powerful S/R level of each day, shown as a clear yellow line. Price is magnetically attracted to these levels.
→ Value Area (VAH/VAL) - See where 70% of all volume traded. These boundaries act as natural support and resistance zones.
→ Session VWAP - Know the true average price institutions paid. Trade with the big players, not against them.
→ Multi-Day Context - Display up to 20 days of volume profiles. Spot when multiple POCs align for high-probability setups.
Why Traders Love It:
✓ Identify TRUE support/resistance based on actual volume - not arbitrary lines ✓ Spot high-probability reversal zones before they happen ✓ Filter out market noise - focus only on levels that matter ✓ Works on Forex, Indices, Crypto, Stocks - any market ✓ Lightweight code - zero lag on your charts ✓ Fully customizable colors and parameters ✓ Clean, professional visualization
Perfect For:
- Mean Reversion traders - Buy at VAL, sell at VAH, target POC
- Breakout traders - Trade Value Area breakouts with confidence
- Day traders - Use previous day POC as your roadmap
- Swing traders - Find major zones where multiple POCs align
Settings:
- Price Levels: 50 (adjustable for any granularity)
- Days to Show: 5 (adjustable 1-20)
- Value Area: 70% (industry standard)
- All colors fully customizable
The Edge You Need:
Lots of retail traders never see volume profile data. They draw random lines and wonder why price ignores them. Volume Profile shows you where the market ACTUALLY finds value - giving you the same view institutions have.
Stop trading blind. Start trading with Volume Profile.
Important Note on Volume Data:
This indicator uses Tick Volume data provided by your broker. Tick Volume counts the number of price changes (ticks) rather than actual traded contracts or lots.
However, numerous studies have shown that Tick Volume strongly correlates with real volume (correlation of 90%+). This means:
→ High Tick Volume = High actual trading activity → Low Tick Volume = Low actual trading activity
The POC, Value Area, and VWAP calculations remain highly accurate and reliable for identifying key support/resistance levels. Professional traders worldwide successfully use Tick Volume for Volume Profile analysis.
For true exchange volume, consider futures markets (ES, NQ, etc.) where real volume data is available.
安全须知
本产品仅通过 MQL5.com 官方渠道获取。其他渠道版本可能缺少完整功能和技术支持。
EA 配置
| 交易品种 | XAUUSD |
| 时间框架 | H1 (推荐) |
| 推荐经纪商 | IC Markets, IC Trading |
| 最低存款 | $300 / 0.01手 |
📸 截图预览