📝 产品详情
Volume Support EMA Signals
| 作者 | Emeka Nwankwo |
| 版本 | v2 |
| 激活数 | 5 |
| 原价 | $45 USD |
Volume Support EMA Signals uses the Volume Z Weighted Exponential Moving Average(VZWEMA) to identify trend signals with demonstrated market support. This is accomplished by using the standard Exponential Moving Average(EMA) Indicator along with a VZWEMA. The VZWEMA is a modified version of the traditional EMA indicator, where the z-scores of the tick volume is used in a weighting scheme that gives more weight for higher volume and less weight for lower volume.
An indicator that features the VZWEMA, as well as the Volume Z-Map Weighted Simple Moving Average(VZWSMA) and the Volume Z-Map Weighted Linear Weighted Moving Average(VZWLWMA) can be found here: https://www.mql5.com/en/market/product/160815?source=Site+Profile+Seller#
There is a strong correlation between tick volume and real volume. This is important for 2 reasons:
- Real volume is a very important indicator because, among many other benefits, it provides strong confirmations of the emergence/dissipation of trends.
- Real volume is not available in Forex, instead, one has to make do with tick volume.
Unfortunately, tick volume is highly broker dependent. Additionally, it is often not used effectively to define indicators. Virtually all indicators that
use tick volume simply use the raw tick volume data as it is presented, but this is not the proper way to use this information. A much more effective approach is to use a
z-score map, whereby, instead of using raw tick volume we instead compute the zscore of the tick volume over a set sampling period, then we use this z-score to
compute a weight. The advantage of this method is at least two fold. Firstly, it reduces the broker dependency, which is a huge problem with volume weighted
indicators. Secondly, it much more effectively emphasizes periods in the price history where the tick volume is unusually high, independent of broker.
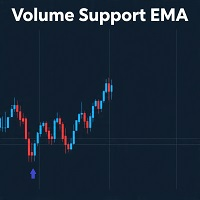
Volume Support EMA is a tool that helps manual traders to identify high probability points to enter trades with buy/sell arrows, as well as their exit points.
The default inputs are best used on EURUSD M1, but the user is encouraged to modify the inputs for other pairs and timeframes.
Additionally, a dashboard is provided to help keep track of the indicators performance.
Below is a list of inputs:
Volume Weighted MA Period
Z Map Sharpness
Z Map Magnification
Z Map Bias
Weight Power
Z Map Floor
MA Type
LineColor
Line Style
Line Thickness
Applied Price
Conventional MA Type
Conventional MA period
Conventional MA line color.
ATR period
Minimum Trend Strength in units of ATR.
Minimum crossback profit in ATR units
Take profit level in ATR
Risk Reward for calculating stoploss.
Buy Take Profit Color
Buy Stop Loss Color
Sell Take Profit Color
Sell Stop Loss Color
Buy Arrow Color
Sell Arrow Color
Arrow Shift
Arrow Size
Unconventional parameters are:
Z Map Sharpness
Z Map Magnification
Z Map Bias
Z Map Weight Power
Z Map Floor
and how they relate to the z-map of the volume.
Z Map Sharpness: Ideal value is 1.0. Z Map Sharpness tells the moving average how quickly to change from conventional moving average to volume weighted version
for any given turning point.
Z Map Magnification: Related to the sensitivity the moving average to the volume. Value will depend on the MA type, for example, if EMA is selected then
set the value to 2.0 for the VWEMA to reduce to conventional EMA when volume is low.
Z Map Bias: This input specifies the level that should be considered "high volume", in other words, the turning point, where the moving average starts to change
from the conventional version to the volume weighted version. A z-score around 0.0 will indicate normal volume, a z-score of less than -1.0
will indicate lower than normal volume, while a z-score of more than 1.0 will indicate unusually high volume. The Z Map Bias input tells the moving average
the level that the volume should surpass to be considered high.
Z Map Weight Power: Ideal value should be 2.0. Related to sensitivity the moving average to the volume.
安全须知
本产品仅通过 MQL5.com 官方渠道获取。其他渠道版本可能缺少完整功能和技术支持。
EA 配置
| 交易品种 | XAUUSD |
| 时间框架 | H1 (推荐) |
| 推荐经纪商 | IC Markets, IC Trading |
| 最低存款 | $300 / 0.01手 |
📸 截图预览