📝 产品详情
Signal panel
| 作者 | Thabang John Wotsa |
| 版本 | v6 |
| 激活数 | 5 |
| 原价 | $80 USD |
Overview
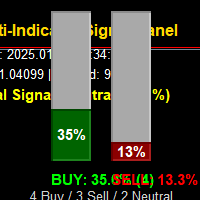
The Multi-Indicator Signal Panel is a comprehensive technical analysis tool for MetaTrader 5 that combines signals from 9 different technical indicators into a single, easy-to-read visual interface. Instead of cluttering your chart with multiple indicators, this tool analyzes them all and presents the combined results through intuitive vertical bar graphs and clear recommendations.
? Visual Interface:
-
Two Vertical Bar Graphs (Green = Buy, Red = Sell)
-
Real-time signal strength display (0-100%)
-
Clean, minimalist design - no indicator clutter
-
Color-coded recommendations
-
Time, price, and spread display
-
Indicator consensus count
⚙️ Customization Options:
-
Adjustable panel position and size
-
Customizable bar colors, width, and height
-
Configurable indicator parameters
-
Adjustable signal thresholds
-
Option to show/hide percentage values
How It Works
Signal Calculation:
-
Each of the 9 indicators generates a signal from -100% to +100%
-
Positive values = Bullish signals
-
Negative values = Bearish signals
-
Absolute value = Signal strength
Bar Graph Display:
-
Buy Bar (Green): Shows combined bullish signal strength
-
Sell Bar (Red): Shows combined bearish signal strength
-
Bar Height: Proportional to signal strength (0-100%)
-
Grows Upward: From bottom to top
Recommendation System:
-
STRONG BUY SIGNAL: Buy bar > 70%, total signal > 60%
-
BUY SIGNAL: Buy bar 40-70%, total signal > 30
-
MILD BUY: Buy bar > sell bar, both < 40%
-
NEUTRAL / WAIT: Both bars low, mixed signals
-
MILD SELL: Sell bar > buy bar, both < 40%
-
SELL SIGNAL: Sell bar 40-70%, total signal < -30
-
STRONG SELL SIGNAL: Sell bar > 70%, total signal < -60
Trading Applications
For Trend Traders:
-
Identify strong trending markets
-
Get confirmation from multiple indicators
-
Avoid false breakouts with consensus signals
? For Range Traders:
-
Identify ranging/consolidating markets (both bars short)
-
Spot breakout opportunities when one bar starts growing
-
Use Bollinger Bands and ATR for volatility insights
⚡ For Day Traders:
-
Real-time updates every second
-
Quick visual assessment of market bias
-
Volume analysis for momentum confirmation
? For Position Traders:
-
Use with higher timeframes (H4, D1)
-
Combined trend and momentum analysis
-
Multiple confirmation sources for higher accuracy
Interpretation Guidelines
Visual Reading:
-
Compare Bar Heights:
-
Green bar taller = Bullish bias
-
Red bar taller = Bearish bias
-
Similar heights = Mixed/uncertain market
-
-
Check Percentages:
-
< 30% = Weak signal
-
30-70% = Moderate signal
70% = Strong signal
-
-
Read the Numbers:
-
Percentage values on bars
-
Indicator count (e.g., "5 Buy / 2 Sell / 2 Neutral")
-
Total combined signal
-
Trading Signals:
-
Enter Long: Strong buy signal, green bar > 70%, multiple indicators agree
-
Enter Short: Strong sell signal, red bar > 70%, multiple indicators agree
-
Exit/Reduce: Opposite bar starts growing, signal weakens
-
Stay Out: Both bars low, recommendation says "WAIT"
Risk Management:
-
Start Conservative: Use default settings first
-
Adjust Thresholds: Change Buy/Sell Thresholds based on your risk tolerance
-
Combine with Fundamentals: Use for technical timing, not sole decision-making
-
Backtest: Test with historical data on your preferred pairs/timeframes
Benefits
✅ Advantages:
-
Time-saving: No need to analyze 9 indicators separately
-
Clear Visualization: Instant market bias assessment
-
Reduced Analysis Paralysis: Clear buy/sell/hold signals
-
Customizable: Adjust to your trading style
-
Real-time: Updates every second
-
Professional: Clean, trader-friendly interface
⚠️ Limitations:
-
Lagging Indicators: All technical indicators lag to some degree
-
No Guarantees: Signals are probabilistic, not certain
-
Market Conditions: Works best in trending markets, less in choppy ranges
-
Not Standalone: Should be used with risk management and other analysis
Ideal For
? Trader Types:
-
Beginner Traders: Simple visual interface, clear signals
-
Intermediate Traders: Customizable, multiple timeframes
-
Advanced Traders: Can adjust parameters for specific strategies
-
Algorithmic Traders: Use signals for EA development
⏰ Timeframes:
-
All Timeframes: From M1 to Monthly
-
Best Results: H1, H4, D1 for reliable signals
-
Scalping: M5-M15 with adjusted parameters
? Market Conditions:
-
Trending Markets: Excellent signal clarity
-
Breakouts: Good for identifying momentum shifts
-
Ranging Markets: Identifies low-volatility periods
? Quick Start:
-
Apply to your preferred chart and timeframe
-
Watch the bars - they update every second
-
Follow color-coded recommendations
-
Adjust parameters after observing performance
-
Combine with your strategy - don't rely 100% on any indicator
? Customization:
-
Move panel by changing PanelX, PanelY
-
Change bar colors to match your chart theme
-
Adjust indicator parameters for your trading style
-
Modify signal thresholds based on risk tolerance
Performance Tips
? For Better Accuracy:
-
Use Higher Timeframes: Signals are more reliable on H4/D1
-
Wait for Confirmation: Don't trade on the first signal
-
Combine with Support/Resistance: Use horizontal levels for better entries
-
Consider Market Hours: Major sessions often provide clearer signals
-
Avoid News Events: High volatility can generate false signals
? Backtesting:
-
Test on at least 100 trades
-
Use different market conditions
-
Adjust parameters based on results
-
Consider drawdown and win rate
Conclusion
The Multi-Indicator Signal Panel is a powerful technical analysis tool that simplifies complex market analysis by combining multiple indicators into an intuitive visual interface. Whether you're a beginner looking for clear trading signals or an experienced trader wanting to save time on analysis, this indicator provides valuable insights into market sentiment and momentum.
Remember: No indicator is perfect. Use this tool as part of a comprehensive trading plan that includes risk management, fundamental analysis (where applicable), and sound trading psychology.
安全须知
本产品仅通过 MQL5.com 官方渠道获取。其他渠道版本可能缺少完整功能和技术支持。
EA 配置
| 交易品种 | XAUUSD |
| 时间框架 | H1 (推荐) |
| 推荐经纪商 | IC Markets, IC Trading |
| 最低存款 | $300 / 0.01手 |
📸 截图预览