📝 产品详情
SM Zones
| 作者 | Arvydas Zukauskas |
| 版本 | v1.4 |
| 更新 | 2025-04-06T19:21:48 |
| 激活数 | 2 |
The charts are most conveniently viewed using light-colored themes. You can create a convenient light theme template and use it for all those frames.
The indicator can be used in two ways:
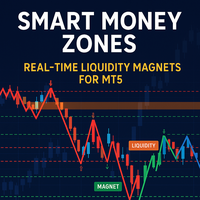
1. In one window: you open the EURUSD chart on any timeframe. We place the SMZones indicator in it, using the default settings. Within a few seconds, the indicator marks the liquidity and market inefficiency zones of the EURUSD price for the last month on the selected timeframe chart, towards which the instrument price is moving according to the principles of the SM trading strategy. During active trading, the indicator analyzes each newly formed bar in real time and marks the newly formed zones. When using the indicator in one window, you can switch from one timeframe to another by selecting the desired timeframe button in the timeframe toolbar.
2. Several indicator windows: you open the EURUSD chart on any timeframe. We place the SMZones indicator in it and in the settings window we mark the necessary timeframes whose charts we want to follow. After confirming the selections, MetaTrader 5 opens the charts of the marked timeframes in separate windows, marking the SM zones in each window. To follow one or another timeframe, you need to switch to the required timeframe chart, where the SM zones will already be marked. Please note that when using the indicator in multi-window mode, you cannot change the timeframe opened in that window using the buttons on the toolbar.
The indicator shows the SM Zones of the instrument on the price chart for the last month, so it is very convenient to use for those learning the principles of the SM strategy, because the history shows how and when the instrument price moved towards one or another zone.
When conducting real trading, the arrangement of the SM zones marked on the chart helps the trader understand the market situation and increases the likelihood of making the right trading decision.
安全须知
本产品仅通过 MQL5.com 官方渠道获取。其他渠道版本可能缺少完整功能和技术支持。
EA 配置
| 交易品种 | XAUUSD |
| 时间框架 | H1 (推荐) |
| 推荐经纪商 | IC Markets, IC Trading |
| 最低存款 | $300 / 0.01手 |
📸 截图预览