📝 产品详情
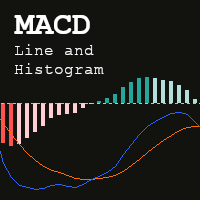
MACD Line and Histogram
| 作者 | Everton Henrique Romera Matumoto |
| 版本 | v3 |
| 更新 | 2 十二月 2025 |
| 激活数 | 5 |
| 原价 | $30 USD |
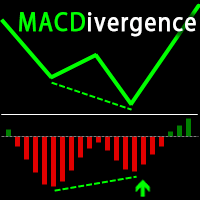
The MACD Line and Histogram is an enhanced version of the classic Moving Average Convergence Divergence (MACD) indicator. While the traditional MACD consists of two lines—the MACD (Main) line and the Signal line—the extended version introduces a Histogram that visually represents the difference between these two lines.
? Inputs
- Fast MA method (Simple, Exponential, Smothed or Linear weighted)
- Fast MA period
- Slow MA method (Simple, Exponential, Smothed or Linear weighted)
- Slow MA period
- Signal MA method (Simple, Exponential, Smothed or Linear weighted)
- Signal MA period
- Applied price (Close, Open, High, Low, Median, Typical or Weighted)
- Show lines
- Show histogram
✅ Advantages Over the Traditional MACD (Main + Signal Only)
- Clearer Visualization of Momentum
The histogram provides an immediate visual cue of whether momentum is accelerating or decelerating, making it easier to spot trend strength without relying solely on line crossings. - Early Signal Detection
Histogram bars often begin to shrink before the MACD Line crosses the Signal Line, offering traders an early warning of potential reversals or weakening trends. - Improved Trend Strength Assessment
The magnitude of histogram bars helps quantify the intensity of bullish or bearish momentum, which is harder to gauge with just two lines. - Reduced Ambiguity
In the traditional MACD, overlapping lines can sometimes be difficult to interpret. The histogram separates this information into a distinct visual layer, reducing confusion. - Enhanced Divergence Analysis
Traders can more easily spot divergences between price action and momentum using the histogram, as changes in bar height highlight subtle shifts that may precede reversals.
安全须知
本产品仅通过 MQL5.com 官方渠道获取。其他渠道版本可能缺少完整功能和技术支持。
EA 配置
| 交易品种 | XAUUSD |
| 时间框架 | H1 (推荐) |
| 推荐经纪商 | IC Markets, IC Trading |
| 最低存款 | $300 / 0.01手 |
📸 截图预览