📝 产品详情
Investing Technical Analysis Ind
| 作者 | HITESH ARORA |
| 版本 | v15 |
| 更新 | 22 三月 2020 |
| 激活数 | 5 |
This indicator provides the technical overview using following tools:
- Pivot Points
- Technical Indicators
- Moving Averages
Pivot Points are calculated using five different methods:
- Classic
- Fibonacci
- Camarilla
- Woodie
- DeMark
With the technical indicator, you can find the trading signals using the combination of different indicators. It supports the following technical indicators:
- RSI
- Stochastic
- Stochastic RSI
- MACD
- ADX
- CCI
- ATR
- Ultimate Oscillator
- ROC
- Bull/Bear Power
Moving Averages is used to find the direction of the trend using multiple Moving Average indicators. It calculates using the following rules:
· Ask < MA, it is SELL
· Bid > MA, it is BUY
· Ask > MA > Bid, it is None (no signal)
After you attached the indicator to a chart it will show the following information on the chart:
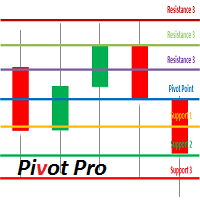
- Pivot point levels
- Technical indicators, their values and the signal generated from them.
- Buy and Sell count
- Summary: Conclusion
- Multiple MAs arranged by their method
- Buy and Sell count
- Summary: Conclusion
You can hide all the information displayed in the chart by setting false to Display on Display Setting.
安全须知
本产品仅通过 MQL5.com 官方渠道获取。其他渠道版本可能缺少完整功能和技术支持。
EA 配置
| 交易品种 | XAUUSD |
| 时间框架 | H1 (推荐) |
| 推荐经纪商 | IC Markets, IC Trading |
| 最低存款 | $300 / 0.01手 |
📸 截图预览