📝 产品详情
Abiroid Extreme TMA System Arrows Indicator
| 作者 | Abir Pathak |
| 版本 | v1.13 |
| 更新 | 2019-12-26T21:45:10 |
| 激活数 | 20 |
| 原价 | $32 USD |
Extreme TMA System with Arrows Indicator
And Buy/Sell Boxes with Take Profit & Stop Loss
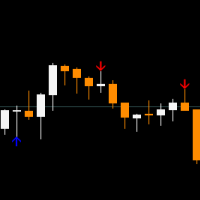
This is a Non-Repainting Arrows Indicator based on the Extreme TMA System.
It shows TMA cross signals and the best BUY/SELL signals. Along with the most predicted TakeProfit. And StopLoss based on TakeProfit ratio.
About Indicator:
This indicator shows BUY/SELL Signal Arrows and also shows most probable Take Profit. And Stop Loss is calculated based on ratio you set for StopLoss:TakeProfit.
There are 3 TMA Bands: Upper, Middle and Lower bands.
When price crosses Upper band, it will reverse and give a SELL Opportunity and if it crosses Lower bands, there is a BUY Opportunity.
Once reversal happens price will go at least up to the middle band.
To verify this reversal, we have to check 3 things:
1. TMA Slope (of current and Higher timeframes)
2. Support/Resistance Lines
3. RSI OverBought/Sold
About Support/Resistance:
If price is close to Support and it crosses the lower band also, it will likely reverse for BUY.
If price is close to Resistance and it crosses the upper band, it will likely reverse for SELL.
BUY SELL Signal Conditions:
– If useHeikenAshiPrice is true – use Heiken Ashi prices
If Price has crossed Upper/Lower bandsIf useRSI is true and Price OverBought/OverSold
If checkCurrentTFSlope or checkHTFSlope – do a Slope Check as described in next section
If “Ignore If TakeProfit Too Close” is true – and price is less than “Min Distance from TakeProfit” percentage. See in section below.
If all conditions match you will get a corresponding BUY or SELL Signal and Alert. BUY is Green Background. SELL is Red background.
Slope Check:
If TMA_SlopeThreshold is 0.3.
If Slope < -0.3 means Bearish Trend so show only SELL Signals. Ignore all BUY SignalsIf Slope > 0.3 means Bullish Trend so show only BUY Signals. Ignore all SELL Signals
If Slope between -0.3 and 0.3 means Market is Ranging. Show both BUY and SELL Signals
If MinDistance is 0.3 means 30%
If 100% distance is between Upper/Lower band and Middle band.
If distance between Upper/Lower band and starting price is already more than 30% then ignore the signal.
Indicator Properties:
- TMA_Period = 50 (Triangular Moving Average Period)- checkHTFSlope = false (Check Slopes for next 3 Higher Timeframes or not)
- checkCurrentTFSlope = true (Check slope for Current Timeframe or not)
- ignoreMNSlope = true (Ignore Monthly chart’s slope or not)
- TMA_SlopeThreshold = 0.3 (Slope Threshold for Checking Bullish/Bearish)
- useRSI = false (If Use RSI true – only trade BUY if RSI OverSold and SELL if RSI OverBought. Else ignore signal)
- RSI_Period = 14
- RSI_OversoldLevel = 30
- RSI_OverboughtLevel = 70
- ignoreTooCloseMiddleBand = true (TakeProfit will be somewhere close to Middle Band. But if price already reached too close to middle band then ignore signal or not)
- minDistFromMiddleBand = 0.3 (0.3 means 30% distance from Middle Band. If ignoreTooCloseMiddleBand true and price reaches more than 30% distance from middle band then ignore signal)
- PredictBestSL_TP_Rectangle = true (Get SL and TP are predictions rectangle. Note these are predictions. Use with Support/Resistance lines for validation)
- SL_Ratio = 1 (Ratio 1 means SL and TP will be 1:1. 0.5 means StopLoss will be half of TakeProfit)
- MaxTakeProfit = 500 (If TakeProfit more than these Points, then reset it to this max. And reset StopLoss to this max * SL_Ratio)
- MinStopLoss = 70 (Ignore signal if StopLoss less than Min Points)
Characteristics:
Platform: Metatrader4Currency pairs: All pairs
Trading Time: Around the clock
Time-frame: All TimeFrames. But higher TF H1, H4+ are better and more stable
安全须知
本产品仅通过 MQL5.com 官方渠道获取。其他渠道版本可能缺少完整功能和技术支持。
EA 配置
| 交易品种 | XAUUSD |
| 时间框架 | H1 (推荐) |
| 推荐经纪商 | IC Markets, IC Trading |
| 最低存款 | $300 / 0.01手 |
📸 截图预览