📝 产品详情
VolumeDeltaFootprint
| 作者 | Stanislav Korotky |
| 版本 | v713 |
| 更新 | 11 七月 2017 |
| 激活数 | 5 |
| 原价 | $25 USD |
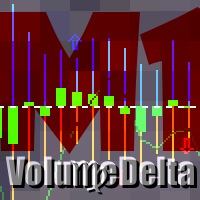
The indicator provides volume delta analysis and visualization. It calculates tick volumes for buys and sells separately, and their delta on every bar, and displays volumes by price clusters (cells) for a specified number of recent bars. This is a special, more descriptive version of the indicator VolumeDelta.
The indicator displays the following data in its sub-window: delta of volumes on every bar as gray histogram, cumulative sum of delta volumes on specified period (green line) and additionally histogram of buy and sell volumes separately (if parameter Display is other than Delta).
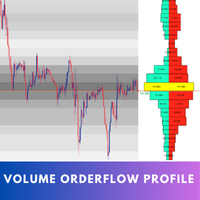
On the main chart, the indicator displays a color map of volumes (as a set of objects) for price clusters inside every bar. The color gradient for buys (positive volumes) and sells (negative volumes) is defined by parameters ColorPositive, ColorNegative, ColorDefault. It is recommended to use Bar chart mode in the chart settings.
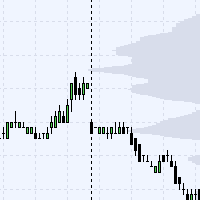
To the right of the last bar, the indicator shows a color map of volume distribution over price clusters for entire range of LastBars bars.
Hover a mouse on an object to see a floating tooltip with volume number in the corresponding cluster.
Parameters
- PointsPerCell - number of points forming a single price cluster; default value - 10;
- LastBars - number of bars for calculation; default - 12; should be larger than 0;
- CumulativePeriod - period for calculation of cumulative delta by EMA; default - 12;
- Display - selector of volume type to show: Delta (default), Sell, Buy, Total;
- ColorPositive, ColorNegative, ColorDefault - colors defining gradients between maximal (positive), miminal (negative) and zero values in the maps.
Supported timeframes: M5 and higher.
After initial placement on a chart, it may take some time for the indicator to download M1 data, and its data may be shown as incomplete. Please wait until the indicator finishes its automatic updates.
安全须知
本产品仅通过 MQL5.com 官方渠道获取。其他渠道版本可能缺少完整功能和技术支持。
EA 配置
| 交易品种 | XAUUSD |
| 时间框架 | H1 (推荐) |
| 推荐经纪商 | IC Markets, IC Trading |
| 最低存款 | $300 / 0.01手 |
📸 截图预览