📝 产品详情
Swing Levels MT4
| 作者 | Sid Ali Temkit |
| 版本 | v2.5 |
| 更新 | 2023-01-08T12:45:13 |
| 激活数 | 5 |
| 原价 | $59 USD |
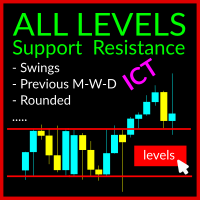
The Swing Levels Support and Resistance Indicator is a robust tool designed for MetaTrader 5 traders (also available for MT4). It aids in identifying crucial market levels where price direction may change by showcasing:
- Swing High and Swing Lows across all timeframes
- Previous Highs and Lows for Day, Week, and Month
- ICT US Midnight level and Yesterday Midnight Level
- ICT US Preopen 8:30 AM Level
- Rounded Levels
This indicator features a toggle button, enabling you to display or hide these levels on the chart at your convenience. This feature ensures a clean chart for analysis while still providing quick access to significant market levels.
The indicator comes with customizable variables, allowing you to select which timeframes and levels to display. This provides valuable insights into the strength of a trend and assists in making informed decisions about entry and exit points.
Boost your trading strategy with our Swing Levels Support and Resistance Indicator, an essential tool for any trader aiming to improve their market success rate. Try it now!
Settings Adjustment:
Access the settings for the indicator by right-clicking on it on the chart and selecting "Properties" from the menu. This will open the "Inputs" tab, where you can adjust various settings for the indicator.
You can select which timeframes to calculate swing highs and lows by setting the corresponding variables to "true" or "false." For instance, to calculate swing highs and lows for the daily timeframe, set the "calculate_swing_Day" variable to "true."
You can also decide whether to display or hide previous highs and lows by setting the "show_Previous_Highs_Lows" variable to "true" or "false."
To adjust the number of past candles used to calculate swing highs and lows, simply set the "Swings_number_of_past_candles" variable to the desired number of candles.
You can also modify the colors of the previous month, week, and day highs and lows by setting the "Previous_Month_Week_Day_Low" and "Previous_Month_Week_Day_Heigh" variables to the desired color.
After adjusting the settings to your preference, click "OK" to apply the changes and close the "Inputs" tab.
Toggle Button Usage: The indicator includes a handy toggle button that allows you to display or hide the levels on the chart at any time. Click on the button on the chart to show or hide the levels. The button will change color to indicate whether the levels are currently displayed or hidden.
Known issue: On first use, multiple clicks may be required.
安全须知
本产品仅通过 MQL5.com 官方渠道获取。其他渠道版本可能缺少完整功能和技术支持。
EA 配置
| 交易品种 | XAUUSD |
| 时间框架 | H1 (推荐) |
| 推荐经纪商 | IC Markets, IC Trading |
| 最低存款 | $300 / 0.01手 |
📸 截图预览