📝 产品详情
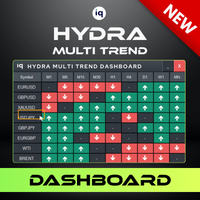
Hydra Multi Trend Dashboard
| 作者 | INTRAQUOTES |
| 版本 | v1.1 |
| 更新 | 12 一月 2026 |
| 激活数 | 5 |
| 原价 | $85 USD |
Using a proprietary Special Trend Formula, the dashboard filters out market noise and provides clear, visual Bullish or Bearish signals, allowing traders to identify trend alignments at a glance without switching charts.
- This product operates only on standard MetaTrader 4 / MetaTrader 5 platforms. Third-party or modified environments are not supported.
- Compatible with live synthetic index charts and not offline charts or custom/synthetic symbols. Read the Note section below.
- Does not provide Data Window values or buffers for EA integration.
- Intended strictly for manual trading; automated or algorithmic usage is not supported.
Note:
This indicator functions on live synthetic index charts (e.g., Volatility and Crash/Boom). But, it does not support offline charts, custom "artificial" symbols created via EAs or scripts, or any user-defined synthetic instruments. For best results, ensure you are attached to a live, server-side data feed. Use on unsupported chart types will result in incorrect rendering or failed signal calculations.
1. Key Features
- Multi-Symbol Monitoring- Scans up to 25 symbols from your Market Watch or a custom list.
- Multi-Timeframe Analysis- Displays trend bias for M1, M5, M15, M30, H1, H4, D1, W1, and MN.
- Proprietary Logic- Uses a specialized internal algorithm to determine trend direction.
- Interactive UI- Click on any symbol name to instantly switch the current chart to that symbol.
- Customizable Design- Includes Dark and Light themes, plus three size options (Small, Standard, Large) to fit any screen resolution.
- Smart Alert- Receive popup or mobile push notifications when a specific timeframe changes trend.
- Green Cell with Up Arrow- Represents a Bullish (Buy) trend.
- Red Cell with Down Arrow- Represents a Bearish (Sell) trend.
- Dash - Represents a Neutral/No Signal state (market is ranging or conditions are not met).
- Minimize Button - Located on the top-right of the dashboard. Click this to collapse the panel and save chart space.
- Close Button - Click this to remove the indicator from the chart.
- Symbol Click - Clicking any symbol name (e.g., "EURUSD") in the left column will update your current chart to that symbol.
- Dashboard Size: Select between Small, Standard, or Large. This adjusts the text and button sizes to fit your screen resolution (e.g., use Large for 4K screens, Small for laptops).
- X Position / Y Position: Adjust the distance (in pixels) from the selected corner to position the dashboard exactly where you want it.
- Corner: Select which corner of the chart the dashboard should anchor to (Top-Left, Top-Right, etc.).
- Theme Selection: Choose between Dark Theme (best for dark backgrounds) or Light Theme (best for white backgrounds).
- Bull Signal (Bg): Select the background color for cells showing a Bullish trend (Default: Green).
- Bear Signal (Bg): Select the background color for cells showing a Bearish trend (Default: Red).
- Bull Arrow / Bear Arrow: Customizes the color of the directional arrows inside the signal cells (Default: White).
- Enable Alerts: Set to true to receive popup alerts in MetaTrader.
- Enable Push Notifications: Set to true to receive alerts on your mobile MetaTrader app.
- Alert Timeframe: Select the specific timeframe you want to monitor for alerts (e.g., H1). You will only receive alerts for trends detected on this specific timeframe.
- Alert Signal Type: Choose to receive alerts for Bullish only, Bearish only, or Both.
- Alert Gap: To prevent spam, choose how often the alert resets (e.g., 60 Minutes). Once an alert triggers for a symbol, it will not trigger again for that symbol until this time has passed.
- Maximum Instances: You can run the dashboard on a maximum of 2 charts simultaneously.
- One Per Chart: You cannot attach more than one dashboard to the same chart window.
- Symbol Limit: The dashboard displays a maximum of 25 symbols.
- Limit Reached Alert: If you see this message, you have tried to add the dashboard to a 3rd chart. Please remove it from an existing chart before adding it to a new one.
- Blank Logo: If the header logo is missing, ensure the required .bmp image files are placed correctly in your MQL4/Images or MQL5/Images folder.
- Symbols Not Loading: If using "Market Watch" mode, ensure your Market Watch window is populated. If using "Manual" mode, ensure the symbol names match your broker's naming convention exactly (e.g., EURUSD.pro vs EURUSD).
- Single Symbol Display: The dashboard will ignore your "Market Watch" or "Manual" symbol lists. It will display only the specific symbol currently being tested (e.g., if you are backtesting EURUSD, only EURUSD will appear on the dashboard).
- Single Timeframe Signal: The dashboard will only calculate and display signals for the specific timeframe selected in your Strategy Tester settings.
Example: If you run a backtest on the H1 timeframe, signals will only appear in the H1 column. All other timeframe columns (M1, M5, H4, etc.) will display a dash () because the Strategy Tester cannot accurately generate data for other timeframes in real-time. - Visual Confirmation: A red text label reading "BACKTESTING MODE" will appear above the dashboard to indicate that restricted functionality is active.
Note: This limitation applies only to the Strategy Tester. Once applied to a live or demo chart, the dashboard will automatically unlock and function normally, monitoring all 25 symbols and all timeframes simultaneously.
8. Support & Updates:
- For assistance, send us a direct message on MQL5.
- Follow our new channel (link given above at the start of the description) for updates and market insights.
- If you encounter any technical issues with the indicator, contact us directly on MQL5.
Related Keywords: trend analysis, trend indicator, trend dashboard, mutitimeframe, trend signal, multitimeframe trend signal, bullish signal, bearish signal
安全须知
本产品仅通过 MQL5.com 官方渠道获取。其他渠道版本可能缺少完整功能和技术支持。
EA 配置
| 交易品种 | XAUUSD |
| 时间框架 | H1 (推荐) |
| 推荐经纪商 | IC Markets, IC Trading |
| 最低存款 | $300 / 0.01手 |
📸 截图预览