📝 产品详情
Multi Asset Multi Timeframe Overlay Chart
| 作者 | Alessandro Bertoli |
| 版本 | v1.0 |
| 更新 | 2024-01-09T09:47:46 |
| 激活数 | 0 |
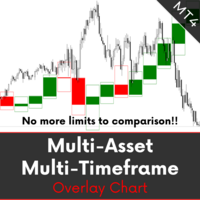
MA MTF Overlay Chart is software that allows you to overlay the candlestick chart of a financial instrument with a second candlestick chart of the same one, or of another, financial instrument, by setting a different timeframe from that of the basic chart.
The software is very simple to use and the input parameters are listed below.
Input parameters:
Overlay chart set-up
- Financial instrument: financial instrument that you want to overlay on the base chart
- Time period: secondary instrument timeframe
- Bull bars color: color of the ascending bars
- Bear bars color: color of the descending bars
- Number of candles to show: number of candles of the secondary instrument you want to display
- Show the Grid: select Yes to display the price grid on the chart, No to hide it
- Color of the Grid: grid color
- Number of Grid lines: number of horizontal lines of the price grid
Notes for correct use:
- The timeframe of the secondary instrument must be higher than that of the base chart.
- It is advisable to update the historical data of both financial instruments to avoid candle display errors.
- Any missing historical data or misalignments between the two financial instruments can create candle display errors.
安全须知
本产品仅通过 MQL5.com 官方渠道获取。其他渠道版本可能缺少完整功能和技术支持。
EA 配置
| 交易品种 | XAUUSD |
| 时间框架 | H1 (推荐) |
| 推荐经纪商 | IC Markets, IC Trading |
| 最低存款 | $300 / 0.01手 |
📸 截图预览