📝 产品详情
Trade Balance Indicator
| 作者 | Vitalyi Belyh |
| 版本 | v1.0 |
| 更新 | 2022-04-30T00:25:10 |
| 激活数 | 0 |
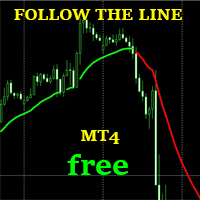
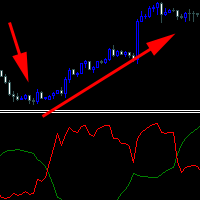
Consists of two lines:
- The green line is a balanced overbought/oversold condition.
- The red line is the direction of trading activity.
Can be used on all Symbols/Instruments/Time Frames.
Easy to use and set up.
How to use the indicator and what it determines.
The basic rule is to follow the direction of the red line:
if it crosses the green line from the bottom up, the market is dominated by bulls.
if it crosses the green line from top to bottom, it means bears prevail.
The green line is the overbought/oversold oscillator.
A break from the upper and lower ranges of an indicator often indicates a change in price direction. You should wait for confirmation of the red line.
Hanging at the upper or lower range means a long trend direction.
The older the Time Frame, the more accurate the calculations.
Input parameters
Calculation Period - The number of bars for the calculation period.
Balance Line Smoothing - Adjustable green line parameter, enhances smoothness.
Number Bars - The number of indicator bars on the chart.
安全须知
本产品仅通过 MQL5.com 官方渠道获取。其他渠道版本可能缺少完整功能和技术支持。
EA 配置
| 交易品种 | XAUUSD |
| 时间框架 | H1 (推荐) |
| 推荐经纪商 | IC Markets, IC Trading |
| 最低存款 | $300 / 0.01手 |
📸 截图预览