📝 产品详情
RSI Candle Signal
| 作者 | Jonathan Destailleur |
| 版本 | v1.0 |
| 更新 | 2019-09-09T19:30:45 |
| 激活数 | 0 |
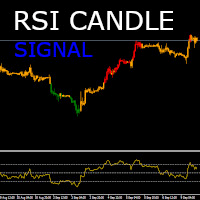
RSI Candle Signal Indicator will change bars’ color when set overbought or oversold levels reach.
How to Use RSI Candle Signal
- Uptrend/Downtrends - RSI may be used to detect trending markets. For example, the RSI may stay above the mid line 50 in an uptrend.
- Top and Buttoms - RSI may help in identifying the tops around the overbought readings (usually above 70), and the bottoms around the oversold area (usually below 30).
- Divergence - divergence occurs when RSI directional movement is not confirmed by the price action. For example, a bullish divergence occurs when EURUSD makes lower low but RSI makes higher low. This means that EURUSD is losing momentum and a bullish correction is possible.
Paramètres ( The setting of the parameters is possible.)
Original Setting :
- RSI Period - 14.
- Overbought - 70.
- Oversold - 30.
安全须知
本产品仅通过 MQL5.com 官方渠道获取。其他渠道版本可能缺少完整功能和技术支持。
EA 配置
| 交易品种 | XAUUSD |
| 时间框架 | H1 (推荐) |
| 推荐经纪商 | IC Markets, IC Trading |
| 最低存款 | $300 / 0.01手 |
📸 截图预览