📝 产品详情
MQLTA Supertrend Line
| 作者 | MQL4 Trading Automation |
| 版本 | v1.2 |
| 更新 | 2017-10-27T10:14:37 |
| 激活数 | 0 |
The Supertrend Line indicator shows you the trend using calculation based on the ATR.
How does it work?
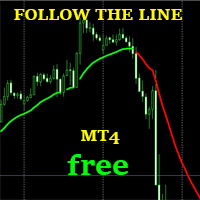
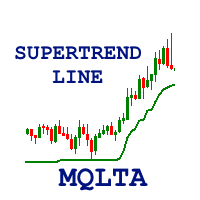
The Supertrend draws a line following the current trend, this line is the result of calculation made with the ATR.
- A Line under the candle means a likely bullish trend
- A Line above the candle means a likely bearish trend
How to trade with CSL indicator
Buy when the Supertrend line is below the price, Sell when the Supertrend line is above the price. It is strongly suggested to use this indicator in a trending market as its weakness is a ranging
Parameters
- ATR Multiplier - the lower it is and the more sensitive is the line, meaning it will follow the price more closely
- ATR Period - Period of the ATR used for the calculation
- ATR Max Bars - Number of bars to draw the lines to
If you like this tool please take a minute to leave a review.
If you have suggestions to improve it please send me a message and we can discuss it further.
Feel free to visit my profile and "Add to friends" https://www.mql5.com/en/users/mql4autotrading.
安全须知
本产品仅通过 MQL5.com 官方渠道获取。其他渠道版本可能缺少完整功能和技术支持。
EA 配置
| 交易品种 | XAUUSD |
| 时间框架 | H1 (推荐) |
| 推荐经纪商 | IC Markets, IC Trading |
| 最低存款 | $300 / 0.01手 |
📸 截图预览