📝 产品详情
Vispucci
| 作者 | Abraham Correa |
| 版本 | v1.776 |
| 更新 | 31 十月 2024 |
| 激活数 | 0 |
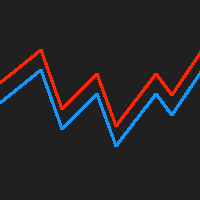
Behaving in a similar fashion as the price action of a chart, the indicator uses "Trix" to opportune itself to the exposure of divergency, flat/low market volume, and price action expansion. The TRIX indicator nicknamed after the Triple-Exponential-average, is a momentum-based oscillator that filters minor price changes and fluctuations that are considered insignificant for forex trading whilst providing money making opportunities! Overall, TRIX is a leading indicator that shows divergency between the indicator and price, showing potential reversals!
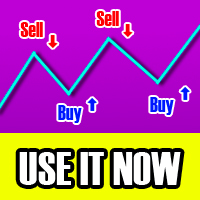
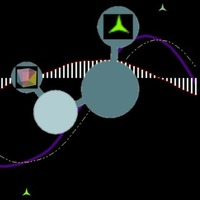
The signal remarks areas of prime importance. It provides the best trading signals with "symbol 169, also seen as a 3-pointed Mercedes sign". It can signal overbought and oversold conditions. The indicator is based on smoothed exponential moving average and is widely used by forex and index traders to prepare the best technical trading strategy. Traders can BUY once the underscored signal appears. Traders are also able to SELL as the signaler appears above the moving averages. The signal provider does not repaint/repent the ongoing course. As of reaching a closing point of trades, the bursting moment MA lines intervene or the opposite signal appears, then would be a valid time to close the trade. Closing a trade is undeniably where one sees reasonable to exit(other than waiting on the opposite signal). Once a signal is shown, a notification is given to the user, alerting for a likelihood of a change in price.This indicator has the oscillator defining the participations of the market, volume rising and narrowing! When the oscillator is thin and had shrunk to a minimal, you'd obviously see the price ranging, stuck in a minimizing trend. An indecision perhaps, there's no money to be found there. Consequently, those signals from a flat market aren't good to use. Keep in mind, you'll be able to strategy test, allowing best attuned scenarios. Don't forget to allow fundamentals guide just as much as technical. There's not a single timeframe recommended but I will mention having music in the background would be great for optimal overview of the market liquidity! HA!
Important Considerations & Known Limitations:
No Trade Context – Patterns are detected without confirming trend, support/resistance, or market phase. Use with discretionary analysis.
No Built-In Risk/Reward Structure – The tool doesn’t set stop loss or take profit targets. Users must manage trade sizing and exits manually.
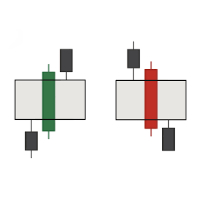
Pattern-Only Logic – Signals are based on candlestick shapes alone and may trigger false positives in choppy or news-driven markets.
No Confirmation Layer – Entries are based on a single candle, without additional momentum or volume filters.
Multi-Timeframe Conflicts – Signals from different timeframes may contradict; users should prioritize a timeframe or apply their own filter logic.
Static Behavior – The indicator doesn’t adapt to changing volatility or trending vs. ranging market conditions.
✅ How to Use It Effectively:
Use as a Visual Alert, Not a Signal Generator
Let the indicator highlight potential reversal or continuation zones. Analyze further before acting.Combine With Trend Structure
Filter signals using trend direction from moving averages or market structure (HH/HL for buys, LH/LL for sells).Apply on Key Support/Resistance Levels
Look for candlestick patterns that appear near known zones of interest — previous highs/lows, supply/demand, or institutional price levels.- Pair With Grid MATR and other custom indications
Confirm the strength of a pattern using volume spikes, RSI divergence, or momentum indicators like MACD or Stochastic.
Select One or Two Timeframes
Avoid signal overload — choose timeframes that fit your strategy (e.g., H1 + H4 for swing, M15 for scalping).Back test With Grid MATR and use EA Predetermination for Trade Management
*Feel free to visit the rest of my profile for additional apps and content*
安全须知
本产品仅通过 MQL5.com 官方渠道获取。其他渠道版本可能缺少完整功能和技术支持。
EA 配置
| 交易品种 | XAUUSD |
| 时间框架 | H1 (推荐) |
| 推荐经纪商 | IC Markets, IC Trading |
| 最低存款 | $300 / 0.01手 |
📸 截图预览