📝 产品详情
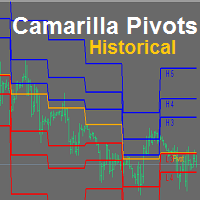
Camarilla Pivots Historical
| 作者 | Noiros Tech |
| 版本 | v1.0 |
| 更新 | 2017-10-10T12:19:22 |
| 激活数 | 0 |
Camarilla Pivots Historical plots the historical data of the camarilla pivot point levels on the chart. The Camarilla Pivot levels was originated in 1989 by Nick Scott. The levels are used as primary support and resistance levels by Intraday traders. The levels are calculated with the following formula:
- R4 = C + RANGE * 1.1/2
- R3 = C + RANGE * 1.1/4
- R2 = C + RANGE * 1.1/6
- R1 = C + RANGE * 1.1/12
- PP = (HIGH + LOW + CLOSE) / 3
- S1 = C - RANGE * 1.1/12
- S2 = C - RANGE * 1.1/6
- S3 = C - RANGE * 1.1/4
- S4 = C - RANGE * 1.1/2
Other than for primary support and resistance, popular usage of the levels include risk management and Intraday trading.
Risk Management
When price approaches the S3 and R3 levels, it is usually possible that a reversal is imminent thus traders usually look to exit their trade positions at these levels.
Trading Cam Reversals
Since traders look forward to a potential reversal at the S3 and R3 levels, they may also take trades in the reversal direction at these levels when they are hit. Thus at an S3 level a day trader looks forward to taking a buy trade and a sell trade at an R3 level.
Trading Cam Breakouts
If price breaks the fourth levels (R4 & S4), price may be heading in a new direction thus trades look to these levels for possible breakout signals. Thus you can take buy trade at an R4 breakout and sell trade at an S4 breakout.
Input
- GMT TimeOffset: Use this option to sync your platform time for Pivot Line Calculation
- Levels To Display: You can display either the first three Pivot Levels (R1,R2,R3,S1,S2,S3) or the last three Pivot Levels (R3,R4,R5,S3,S4,S5)
- Display Level Texts ?: Enable/Disable Pivot labels
- Resistance Text color: Resistance Label Color
- Support Text Color: Support Label Color
安全须知
本产品仅通过 MQL5.com 官方渠道获取。其他渠道版本可能缺少完整功能和技术支持。
EA 配置
| 交易品种 | XAUUSD |
| 时间框架 | H1 (推荐) |
| 推荐经纪商 | IC Markets, IC Trading |
| 最低存款 | $300 / 0.01手 |
📸 截图预览