📝 产品详情
Vanesa price distribution
| 作者 | Vo Mai Chi |
| 版本 | v1.0 |
| 更新 | 2019-01-29T17:43:33 |
| 激活数 | 0 |
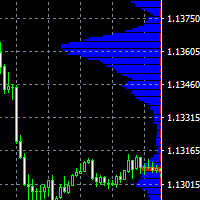
Horizontal histogram help find out key levels of price so that you can make good decision on setting point of take profit, stop loss...
You can improve exist trading strategy or get new trading idea with the histogram of price.
Outstanding features
Support multiple time frame: you can choose to work with history data in any time frame you want. It does not depend on current display time frame.
Support weighting by volume and/or time: the distribution histogram of price can be calculated with volume weighted and/or time (newer prices have higher weight than old price).
Full control on history data selection: we provide a set of parameters so that trader can choose history data in the most flexibility way.
Flexible on histogram displaying: support multiple histogram on a chart windows, can resize and change position/direction/color ... for histogram.
How to use
How to use
Step 1: select period of data history to calculate histogram(can use default value).
Step 2: select the way to display histogram (can use default value).
Step 3: enjoy the price distribution histogram. I am sure that you would get many new trading ideas by price histogram and it is also used to improve your exist trading strategy.
Parameters
Part 1: to specify history data(data frame, start point, end point, data length).
- DATA TIME FRAME: data frame of history data on which distribution price is calculated.
- LAST_POINT_OF_DATA_OPTION: how do we specify the last point of history data? we have 5 options to specify it.
- UP_TO_NEWEST_BAR: the last point history data is before the last candle stick (position 0).
- UP_TO_LAST_VISIBLE_BAR: the last point of history data is the right most candlestick on the current chart and converted to selected time frame.
- UP_TO_FIRST_VISIBLE_BAR: the last point of history data is the first visible bar on the current chart and converted to selected time frame.
- UP_TO_SPECIFIED_X_AXIS:
the last point of history data is the candlestick at X axis on current
chart. The value of X axis is specified by parameter <LAST_POINT_OF_DATA_X_AXIS>
- UP_TO_SPECIFIED_TIME: the last point of history data is specified by time. The value is specified by parameter <LAST_POINT_OF_DATA_IN_TIME>
- HISTORY_DATA_LENGTH_OPTION: this is the option to specify length of history data. It means how to calculate the start point of history data base on last point of history data. There are 4 options for this parameter.
- BY_DAY_COUNT: to specify data length by days of data. In this case, number of days of history data is specified by parameter <HISTORY_DATA_LENGTH_IN_DAYS>
- BY_BAR_COUNT: to specify data length by number of bars on selected data time frame. In this case, number of bars of history data is specified by parameter <HISTORY_DATA_LENGTH_IN_BARS>
- FROM_FIRST_VISIBLE_BAR: the start point of history data is the first visible bar on the current chart and converted to selected time frame.
- FROM_SPECIFIED_TIME: the start point of history data is specified by time. The value is specified by parameter <START_POINT_OF_DATA_IN_TIME>
- USE_VOLUME_WEIGHT: to turn on/off weight of volume data on distribution price histogram.
- USE_TIME_WEIGHT: to turn on/off weight of time on distribution price histogram. Price of new bar has more weight than price of old bar.
- HISTOGRAM_DISPLAY_OPTION: there are two option: RIGHT_TO_LEFT (default) and LEFT_TO_RIGHT
- HISTOGRAM_X_AXIS: the X axis value of histogram. This value depend on <HISTOGRAM_DISPLAY_OPTION>
- HISTOGRAM_WIDTH: the width in pixel of histogram. Default is 100 pixels.
- GRID_SIZE_IN_POINT: size of grid in histogram. the value is in point of price.
- PRICE_HISTOGRAM_COLOR: color of histogram.
- HIGHLIGHT_LAST_HIS_PRICE: to turn on/off highlight part in histogram. If this option is turned on. Histogram will highlight the area it is near value of last history price.
- HIGHLIGHT_COLOR: color of highlight part in histogram.
- HIGHLIGHT_WIDTH: height in pixel of highlight part in histogram.
Part 4: to turn on/off marking history data area.
Part 5: to turn on/off displaying comment for histogram.
安全须知
本产品仅通过 MQL5.com 官方渠道获取。其他渠道版本可能缺少完整功能和技术支持。
EA 配置
| 交易品种 | XAUUSD |
| 时间框架 | H1 (推荐) |
| 推荐经纪商 | IC Markets, IC Trading |
| 最低存款 | $300 / 0.01手 |
📸 截图预览