📝 产品详情
YY Line of Renko on the Chart
| 作者 | Yuryi Yatsenko |
| 版本 | v1.0 |
| 更新 | 2022-09-16T20:10:45 |
| 激活数 | 0 |
This indicator is the basis for an Expert Advisor that can be categorized as "almost Grail". See details below.
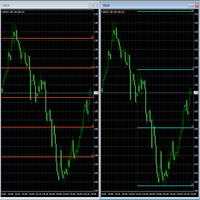
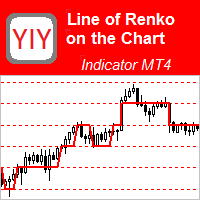
This indicator displays the projection of the Renko chart on the price chart. This projection is displayed as a stepped line, not as "bricks" (rectangles). See slides 1 and 2. Abbreviated name of the indicator: LRC – Line of Renko on the price Chart.
The principle of its construction is very simple. First, a grid of horizontal lines (levels) is built with a given step and offset. Then a Renko Line is built using these levels: if the price touches a new neighboring level, then the Renko Line "jumps" to this level, forming a "step". If the price of this candle does not touch any of the neighboring levels, then the Line continues to the right.
Despite its simplicity, on the basis of this indicator (as mentioned above) it is possible to build an Expert Advisor that has the characteristics of "almost Grail". An example of such an Expert Advisor called "Renko Random Robot" can be seen here [link]. But first things first. First, let's take a closer look at this indicator, and why it is the basis of the "almost Grail". Then (optionally) you can view the Expert Advisor built on the basis of this indicator using the link above.
- Step of Levels in points – level grid step in points, on the basis of which the Renko Line is built;
- Shift of Levels in points – shift of the entire grid of levels in points (a negative number means a shift down);
- Show Level Lines – show the level grid;
- Level Line Color – the color of the grid lines of the levels;
- Level Line Style – the style of the grid lines of the levels;
- Level Line Width – the width of the grid lines of the levels.
Firstly, it shows the price movement in a more general (compressed) and simplified way. And this, in turn, simplifies the analysis of price movements. What is meant? As you know…
* * *
<For the continuation and full text of the description, see the attached file in the first post on the "Comments" tab>
安全须知
本产品仅通过 MQL5.com 官方渠道获取。其他渠道版本可能缺少完整功能和技术支持。
EA 配置
| 交易品种 | XAUUSD |
| 时间框架 | H1 (推荐) |
| 推荐经纪商 | IC Markets, IC Trading |
| 最低存款 | $300 / 0.01手 |
📸 截图预览