📝 产品详情
CCFp Histogram
| 作者 | Anthony Bourne |
| 版本 | v1.0 |
| 激活数 | 0 |
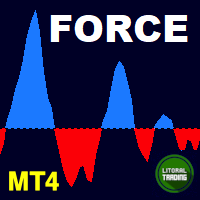
This indicator is like a special kind of thermometer that measures the strength of the current currency pair you're looking at. Instead of showing temperature, it shows whether the pair is gaining strength or losing strength at any given moment, presented as an easy-to-read histogram (those vertical bars) in a separate window below your main chart.
Here's how it works in simple terms: The indicator uses two different speed settings to analyze the price - one "fast" setting (which reacts quickly to recent price changes) and one "slow" setting (which gives a broader picture over more time). It compares these two readings and shows you the difference between them as a percentage. When the faster reading is higher than the slower one, the indicator shows green bars going upward - this means the currency pair is showing strength at that moment. When the faster reading is lower than the slower one, it shows red bars going downward - this means the pair is showing weakness.
What makes this really useful is how clearly it presents this information. You don't need to calculate anything yourself, just glance at the histogram window. Green bars above the zero line immediately tell you there's bullish momentum, while red bars below the zero line tell you there's bearish momentum. The taller the bars, the stronger the momentum. You can customize the colors (maybe you prefer blue instead of lime, or orange instead of red) and adjust how many bars back in history you want to see.
There's also a helpful option about when to calculate the current bar. If you set it to "true" (which is the default), it will update the current open bar in real-time as new price data comes in. If you set it to "false," it will wait until the bar closes before showing the final calculation, which some traders prefer for more stable signals.
Think of this indicator as a momentum gauge that helps you answer the question: "Is this currency pair gathering strength or losing steam right now?" It's particularly useful for spotting potential trend changes early, confirming existing trends, or identifying when a trend might be running out of energy. It works on any timeframe, so whether you're a day trader looking at 5-minute charts or a long-term trader analyzing daily charts, this same principle applies where green means strength, red means weakness, and the height of the bars tells you how much.
安全须知
本产品仅通过 MQL5.com 官方渠道获取。其他渠道版本可能缺少完整功能和技术支持。
EA 配置
| 交易品种 | XAUUSD |
| 时间框架 | H1 (推荐) |
| 推荐经纪商 | IC Markets, IC Trading |
| 最低存款 | $300 / 0.01手 |
📸 截图预览