📝 产品详情
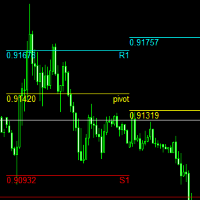
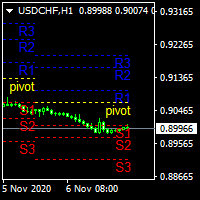
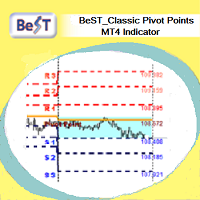
BeST Classic Pivot Points
| 作者 | Eleni Koulocheri |
| 版本 | v1.0 |
| 更新 | 2019-10-19T17:47:23 |
| 激活数 | 0 |
BeST_ Classic Pivot Points is an MT4 Indicator that is based on the widely known and definitely classic Pivot Point of a market
prices activity.
A pivot point is calculated as an average of significant prices (high,low,close) from the performance of a
market in the prior trading period. If the market in the following period trades above the pivot point it is usually evaluated as a
bullish sentiment, whereas trading below the pivot point is seen as bearish.
A pivot point and the associated support and resistance levels are often turning points for the direction of price movement in a market.
In an up-trending market, the pivot point and the resistance levels may represent a ceiling level in price above which the uptrend is no longer sustainable and a reversal may occur.In a declining market, a pivot point and the support levels may represent a low price level of stability or a resistance to further decline ( Wikipedia).
The calculation for a PP and its associated S & R levels is shown below:
- Pivot point (PP) = (High + Low + Close)/3
- First resistance (R1) = (2 x PP) – Low
- First support (S1) = (2 x PP) – High
- Second resistance (R2) = PP + (High – Low)
- Second support (S2) = PP – (High – Low)
- Third resistance (R3) = High + 2(PP – Low)
- Third support (S3) = Low – 2(High – PP)
Trading with pivot points is the ultimate support and resistance strategy.It takes away the subjectivity involved
with manually plotting S and R levels.
Input Parameters
Basic Settings
- Select Current Day's Rectangle Color – for selecting the color of the Rectangle that includes all the bars of the current day
- Select Current Day's Vertical Line Color - for selecting the color of the Vertical Line that specifies the starting moment of the current day
- Show Sunday Trading Hours – true if on our Chart there are trading bars on some hour of Sunday and false otherwise
- Sunday Trading Start Time – for making input the exact time that trading starts on
Pivots Settings
For selecting the color, style and size of drawn lines and text.
安全须知
本产品仅通过 MQL5.com 官方渠道获取。其他渠道版本可能缺少完整功能和技术支持。
EA 配置
| 交易品种 | XAUUSD |
| 时间框架 | H1 (推荐) |
| 推荐经纪商 | IC Markets, IC Trading |
| 最低存款 | $300 / 0.01手 |
📸 截图预览