📝 产品详情
Market Profile With Dashboard
| 作者 | Israr Hussain Shah |
| 版本 | v6 |
| 激活数 | 5 |
| 原价 | $30 USD |
Market Profile with Dashboard Indicator - Complete User Guide
indicator Overview
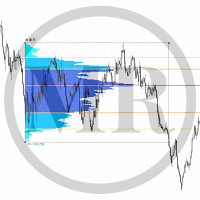
The Market Profile with Dashboard is a comprehensive trading analysis tool for MetaTrader 4 that displays market profile data, volume analysis, and key market structure information directly on your chart. This indicator helps traders identify significant price levels, market balance areas, and potential trading opportunities based on market profile theory.
Core Components and Features
Market Profile Display
- - Shows Time Price Opportunity (TPO) or Volume Profile histograms on the chart
- - Displays Point of Control (POC) - the price level with highest trading activity
- - Plots Value Area (VA) representing 70% of trading activity (configurable)
- - Highlights Value Area High (VAH) and Value Area Low (VAL) boundaries
Key Levels Identification
- - Point of Control (POC): Price with maximum trading activity
- - Value Area High/Low: Boundaries containing 70% of trading activity
- - Initial Balance (IB): First hour trading range
- - Single Prints: Isolated price levels indicating potential breakout areas
- - Volume Nodes: High and low volume concentration areas
Market Structure Analysis
- - Identifies market day types: Trending, Balancing, or Neutral
- - Detects market structure: Normal, Double Distribution, or Non-trending
- - Recognizes price acceptance/rejection at key levels
- - Identifies tails and spikes at price extremes
Dashboard Information Panel
- - Real-time market data display
- - Current key levels visualization
- - Market structure interpretation
- - Trading recommendations
- - Alert history tracking
Installation and Setup
- Step-by-Step Installation
- Download the MarketProfileWithDashboard.mq4 file
- Copy the file to your MetaTrader 4 experts/indicators folder
- Restart MetaTrader 4 or refresh the indicators list
- Attach the indicator to any chart from the Custom Indicators menu
Initial Configuration
- Basic Settings
- - LookBack: Number of profiles to display (default: 2)
- - UseVolumeProfile: Toggle between TPO and Volume Profile (default: true)
- - ProfileTimeframe: Timeframe for profile calculation D, W, or M (default: D)
- - DayStartHour: Start hour for daily profiles (default: 0 for midnight)
Visual Settings
- - ShowPriceHistogram: Display price distribution histogram
- - ShowValueArea: Highlight the value area
- - ShowVAHVALLines: Draw Value Area boundary lines
- - ShowOpenCloseArrow: Mark session open/close prices
- - ShowInitialBalance: Display initial balance range
- - ShowSinglePrints: Highlight single print areas
- - ShowVolumeNodes: Mark high/low volume nodes
- - ShowMarketStructure: Enable market structure analysis
- - ShowSignals: Display trading signals
- - ShowInsightsPanel: Show the information dashboard
Technical Parameters
- - VATPOPercent: Value area percentage (default: 70.0)
- - TickSize: Minimum price movement (default: 1)
- - ExtendedPocLines: Number of POC lines to extend (default: 5)
- - VolAmplitudePercent: Histogram width percentage (default: 40.0)
- - HistoHeight: Histogram bar height (default: 2)
Alert Settings
- - EnableAlerts: Turn alerts on/off
- - AlertOnPOCBreak: Alert when price breaks POC
- - AlertOnVABreak: Alert when price breaks Value Area
- - AlertOnPatternDetection: Alert on market structure patterns
- - UseMT4Notifications: Send MT4 push notifications
How to Use the Indicator
- - The histogram shows price distribution over the selected period
- - Wider histogram areas indicate high trading activity
- - Narrow areas show low trading activity
- - POC line marks the price with maximum activity
- - Value Area contains the majority of trading activity
interpreting Key Levels
- - Trade above VAH suggests bullish sentiment
- - Trade below VAL suggests bearish sentiment
- - POC acts as a magnet for price movement
- - Initial Balance provides early session reference
- - Single Prints indicate potential breakout zones
Market Structure Analysis
- - Trending Day: Price moves strongly in one direction
- - Balancing Day: Price rotates within a range
- - Normal Day: Typical balanced market activity
- - Double Distribution: Two separate value areas
- - Non-trending: Lack of clear direction
Trading Signals Interpretation
- - Acceptance above VAH: Bullish trend likely
- - Acceptance below VAL: Bearish trend likely
- - Rejection above VAH: Potential bearish reversal
- - Rejection below VAL: Potential bullish reversal
- - Tail at top: Selling pressure at highs
- - Tail at bottom: Buying pressure at lows
Dashboard Information Usage
Real-time Market Data
- - Current symbol and timeframe information
- - Live spread and point value display
- - Current price and trend direction
- - Volume information
Key Levels Monitoring
- - POC, VAH, VAL values updated in real-time
- - Initial Balance high and low levels
- - Distance from current price to key levels
Market Analysis
- - Day structure classification
- - Market type identification
- - Professional interpretation of market conditions
- - Trading recommendations based on profile analysis
Risk Management Features
- - Suggested stop-loss levels using VAH/VAL
- - Position sizing guidance
- - Market condition assessment
Alert System
- - Visual and audio alerts for key level breaks
- - Pattern detection notifications
- - MT4 mobile notifications option
- - Alert history tracking
Trading Strategies
Range Trading Strategy
- - Buy near VAL with stop below VAL
- - Sell near VAH with stop above VAH
- - Target the opposite value area boundary
- - Use Initial Balance for additional confirmation
Breakout Trading Strategy
- - Watch for price acceptance above VAH or below VAL
- - Enter on retest of broken level
- - Use single prints as potential breakout targets
- - Monitor volume nodes for confirmation
POC Trading Strategy
- - Trade bounces from POC in balanced markets
- - Use POC as profit target in trending markets
- - Combine with market structure analysis
- - Watch for POC breaks as trend confirmation
Best Practices
- Timeframe Selection
- - Use higher timeframes (H1, H4, D1) for major levels
- - Lower timeframes for precise entry timing
- - Match profile timeframe to your trading style
Multiple Timeframe Analysis
- - Apply indicator to multiple timeframes
- - Identify confluence of key levels
- - Use higher timeframe profiles for direction
- - Lower timeframe profiles for execution
Risk Management
- - Always use stop-loss orders
- - Position size based on distance to key levels
- - Monitor market structure changes
- - Adjust strategy based on market type
Performance Optimization
- - Reduce LookBack for better performance
- - Disable unused features if not needed
- - Use appropriate calculation intervals
- - Monitor system resource usage
Troubleshooting
- Common Issues
- - Indicator not appearing: Check installation folder
- - No profiles displayed: Verify timeframe compatibility
- - Calculation errors: Adjust LookBack parameter
- - Performance issues: Reduce profile count or disable features
Compatibility Notes
- - Works best with major currency pairs
- - Optimal on H1 and higher timeframes
- - Requires sufficient historical data
- - May need adjustment for low-liquidity instruments
Support and Updates
- - Regular updates for MT4 compatibility
- - Bug fixes and performance improvements
- - Feature enhancements based on user feedback
This comprehensive Market Profile indicator provides professional-level market analysis, helping traders make informed decisions based on market structure, volume analysis, and price distribution patterns.
安全须知
本产品仅通过 MQL5.com 官方渠道获取。其他渠道版本可能缺少完整功能和技术支持。
EA 配置
| 交易品种 | XAUUSD |
| 时间框架 | H1 (推荐) |
| 推荐经纪商 | IC Markets, IC Trading |
| 最低存款 | $300 / 0.01手 |
📸 截图预览