📝 产品详情
ARKA Logical Trader vL MT4
| 作者 | Aren Davidian |
| 版本 | v3.50 |
| 更新 | 2023-05-24T12:22:07 |
| 激活数 | 0 |
This indicator is based on Mr. Mark Fisher's ACD strategy, based on the book "The Logical Trader."
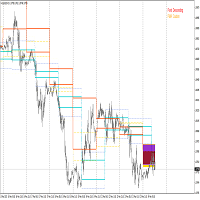
- OR lines
- A lines
- C lines
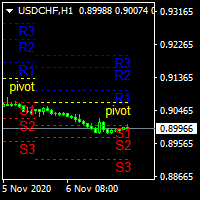
- Daily pivot range
- N days pivot range
- Customizable trading session
- Drawing OR with the desired time Drawing levels A and C based on daily ATR or constant number
- Possibility to display daily and last day pivots in color zone
- Displaying the status of daily PMAs (layer 4) in the corner of the chart
- Show the order of daily pivot placement with multi-day pivot (layer 2)
- Possibility to change the percentage of ATR for levels A and C
- Draw PMAs on The Daily Time Frame
Strategy summary (This implementation):
There is 3 main concepts, each of which represented as two price levels.
1) OR (Opening Range) is the range of the first bar of the day. In other words, it's just "high - low" of the first resolution (usually 15min.) bar of the day. So, OR lines (DarkTurquoise color) visualize this range for each trading session.
As stated by Mark Fisher in his book, this range is meant to be a statistically significant range such that when price breaks the range in one direction, This is UNUSUAL to infiltrate it again AND break through the other side. So we can consider it as a potential enter signal (long or short).
2) A lines (RoyalBlue color) are drawn above and below OR lines with difference of 10% 0f 10 days ATR. The ATR period and the A multiplier (usually 10%) is customizable.
3) C lines (LightYellow color) are drawn above and below OR lines at 15% of 10 Days ATR difference. These lines help detecting AND confirming that UNUSUAL situation.
These concepts form the layer 1, which you can spot potential opportunities with it.
These two ranges, "Daily pivot range" and "N days pivot range", form the layer 2, which you can see them as two dynamic support/resistance ranges - one for daily, and the other for N days. They help filtering opportunities spotted from layer 1.
安全须知
本产品仅通过 MQL5.com 官方渠道获取。其他渠道版本可能缺少完整功能和技术支持。
EA 配置
| 交易品种 | XAUUSD |
| 时间框架 | H1 (推荐) |
| 推荐经纪商 | IC Markets, IC Trading |
| 最低存款 | $300 / 0.01手 |
📸 截图预览