📝 产品详情
Plot results
| 作者 | Vladimir Tkach |
| 版本 | v1.4 |
| 更新 | 2017-11-17T07:51:00 |
| 激活数 | 5 |
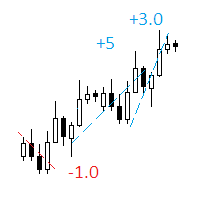
The indicator displays on a chart trading results. You can configure the color and font of displayed results, as well as filter trades based on the magic number. If multiple trades were closed within one bar of the current timeframe, the result is summed and output in one value.
Utility parameters
- Plot profit in - the format of output results: wither in deposit currency taking onto account commission and swap, or in points.
- Start from - start processing data at the specified time.
- Plot last deals in history - limit the maximum number of output trades.
- Use last bars in history - limit data output by the number of bars of the current timeframe.
- Font - the font of the displayed text.
- Size - the font size.
- Angle - angle to display data: 0 - horizontally, 90 - vertically.
- Color for buy and profit - the color of buy lines and of profit font.
- Color for sell and loss - the color of sell lines and of loss font.
- Magic number (0 - all deals) - the magic number of processed trades, 0 means all trades.
安全须知
本产品仅通过 MQL5.com 官方渠道获取。其他渠道版本可能缺少完整功能和技术支持。
EA 配置
| 交易品种 | XAUUSD |
| 时间框架 | H1 (推荐) |
| 推荐经纪商 | IC Markets, IC Trading |
| 最低存款 | $300 / 0.01手 |
📸 截图预览