📝 产品详情
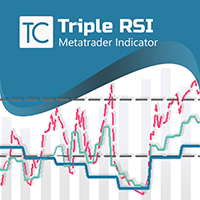
Triple RSI
| 作者 | Pablo Leonardo Spata |
| 版本 | v1.0 |
| 更新 | 2021-04-15T01:30:16 |
| 激活数 | 0 |
1. ✔️ Idea behind the indicator and its strategy:
In Trading, be it Forex or any other asset, the ideal is to keep it simple, the simpler the better. The triple RSI strategy is one of the simple strategies that seek market returns.
In our experience, where there is more money to always be won, is in the market turns. It is clear that catching a price turn is difficult.
2. ✔️ Triple RSI Strategy:
The key to this Triple RSI strategy is in the concept of OVERSELLING or OVERPURCHASING.
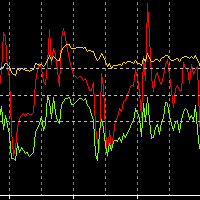
When we use the RSI, there are two key zones 70 and 30, as limit zones and that indicate that the price has gone too far, and that it can turn.
This is not always the case, because the market can remain excited for a long time, we can even pull charts and check that when the indicator enters these areas, there is still a bullish or bearish path.
But we are not going to go short or long, because the indicator is at 70 or 30, it is only a reference, it is the alert position of the system, not the "Trigger" of the system.
For the triple RSI strategy, what we are going to use are three different and correlative time charts.
? It can be 15 minutes, 1 hour and 4 hours. Also 1 hour, 4 hours and dailychart, or 1 minute, 15 minutes and 1 hour. ?
3. ✔️ Inputs of the Triple RSI strategy, step by step:
Follow the following steps and help yourself with the screenshots attached below.
Steps to BUY ?:
1. Wait for all 3 lines of the indicator to be oversold.
2. Draw a trend line on the chart.
3. Buy when the trend line breaks.
Steps to SELL ?:
1. Wait for the 3 lines of the indicator to be overbought.
2. Draw a trend line on the chart.
3. Sell when the trend line breaks.
Stop loss can be placed above or below the last swing.
4. ✔️ Input parameters the indicator:
- RSI 1 Lower Period
- RSI 1 Lower TimeFrame
- RSI 2 Middle Period
- RSI 2 Middle TimeFrame
- RSI 3 Upper Period
- RSI 3 Upper TimeFrame
- Styles, colors and levels of the lines
??? Would you like something else? ???
My personal link to hire me to new job: https://www.mql5.com/en/job/new?prefered=pablospata.
安全须知
本产品仅通过 MQL5.com 官方渠道获取。其他渠道版本可能缺少完整功能和技术支持。
EA 配置
| 交易品种 | XAUUSD |
| 时间框架 | H1 (推荐) |
| 推荐经纪商 | IC Markets, IC Trading |
| 最低存款 | $300 / 0.01手 |
📸 截图预览