📝 产品详情
Radar Dashboard
| 作者 | Eduardo Kipper |
| 版本 | v1.0 |
| 激活数 | 8 |
| RADAR DASHBOARD |
|---|
-
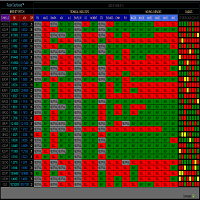
The Radar Dashboard shows the current "Trend Feeling" of each symbol based on the key indicators from the Classic Technical Analysis. As more indicators shift from Sell to Buy, it is suggested that the Trend is now Up (buy). As more indicators change from Buy to Sell, it is suggested that the Trend is now Bearish (sell). The interpretation by the columns of "CANDLES" can also show us possible reversals or pullbacks. For example: A large amount of red squares in H4 (bear candle) means that the symbol has been falling for a long time, and calls our attention to a reversal or pullback after a doji candle (yellow square), or indecision candle .
- In Metatrader Chart Properties, configure chart background so that all items are colorless. (Background, Foreground, Grid, Bar Up, Bar Down, Bull candle, Bear Candle, Line graph, Volumes, Ask Line, Stop levels ).
- Attach the EA to the chart (it can be anything as the Radar Dashboard is Multi Symbol).
- Choose or change when you prefer graphic time according to your analysis.
- With the EA attached, in Properties, fill all 30 symbols with the syntax according to your broker (ex: AUDCAD, or AUDCAD# or AUDCADmicro) and so on.
- Wait for the EA to load. If it takes too long, open the History Center in the Metatrader Tools tab and download the symbols that will be read in the Radar Dashboard.
- Resolution : 1360 x 768
- The Radar Dashboard can only be viewed with the Financial Market working.
| CANDLES SCAN | HOW TO ANALYZE COLORS. |
|---|---|
| GREEN SQUARE | BULL CANDLE |
| RED SQUARE | BEAR CANDLE |
| YELLOW SQUARE | DOJI CANDLE |
| BLUE SQUARE | BULL CANDLE GREATER THAN "X" PIPS, CONFIGURABLE IN THE PARAMETER ***CANDLE ALARM*** |
| MAGENTA SQUARE | BEAR CANDLE GREATER THAN "X" PIPS, CONFIGURABLE IN THE PARAMETER ***CANDLE ALARM*** |
| C0 = CURRENT CANDLE // C1 = PREVIOUS CANDLE // C2 = PREV.PREVIOUS CANDLE....... |
| TECHNICAL INDICATORS | HOW TO ANALYZE COLORS. |
|---|---|
| GREEN RECTANGLE (BUY) | HIGH TREND |
| RED RECTANGLE (SELL) | DOWN TREND |
| GRAY RECTANGLE (NEUTRAL) | SIDE MARKET |
| MOVING AVERAGES | HOW TO ANALYZE COLORS. |
|---|---|
| GREEN RECTANGLE (BUY) | HIGH TREND |
| RED RECTANGLE (SELL) | DOWN TREND |
| GRAY RECTANGLE (NEUTRAL) | SIDE MARKET |
安全须知
本产品仅通过 MQL5.com 官方渠道获取。其他渠道版本可能缺少完整功能和技术支持。
EA 配置
| 交易品种 | XAUUSD |
| 时间框架 | H1 (推荐) |
| 推荐经纪商 | IC Markets, IC Trading |
| 最低存款 | $300 / 0.01手 |
📸 截图预览