📝 产品详情
Dema macd zone Divergence
| 作者 | Mahmoud Ahmed Abdou Ali |
| 版本 | v5.11 |
| 更新 | 14 十二月 2025 |
| 激活数 | 0 |
Indicator: The DEMA MACD Zone Divergence
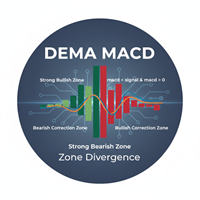
This is a powerful, multi-timeframe trend-following indicator based on the Moving Average Convergence Divergence (MACD), but enhanced using Double Exponential Moving Averages (DEMA) for reduced lag. Its main function is to paint the background of the price chart with color-coded rectangular zones, clearly signaling the current momentum phase and potential shifts in market control (bullish or bearish).
? Core Purpose
To visually map the strength and phase of the price trend directly onto the main price chart, eliminating the need to constantly watch an oscillator window. It uses the crossover of the DEMA MACD line and its Signal line, combined with the zero level, to define four distinct market zones.
⚙️ Functional Description (What it Does)
The indicator operates in three main stages: Calculation, Zone Mapping, and Alerting.
1. Calculation: The DEMA Advantage
Instead of using simple Exponential Moving Averages (EMAs) like the standard MACD, this indicator uses the faster, less-lagging Double Exponential Moving Average (DEMA):
-
MACD Line Calculation: Calculated as the difference between a Fast DEMA and a Slow DEMA of the price.
-
Signal Line Calculation: Calculated as a DEMA of the MACD line itself.
The use of DEMA allows the indicator to react more quickly to changes in momentum compared to a traditional MACD, providing earlier, though potentially higher-risk, signals.
安全须知
本产品仅通过 MQL5.com 官方渠道获取。其他渠道版本可能缺少完整功能和技术支持。
EA 配置
| 交易品种 | XAUUSD |
| 时间框架 | H1 (推荐) |
| 推荐经纪商 | IC Markets, IC Trading |
| 最低存款 | $300 / 0.01手 |
📸 截图预览