📝 产品详情
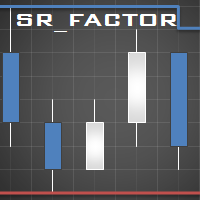
SRFactor
| 作者 | Aleksandr Teleguz |
| 版本 | v1.3 |
| 更新 | 2018-07-11T17:13:46 |
| 激活数 | 0 |
Brief description of the principle of identifying the market highs and lows
A short-term high is a high of a bar with lower highs on either side of it, and, conversely, a short-term low of a bar is a low with higher lows on either side of it. Medium-term highs and lows are determined similarly: a medium-term high is a short-term high with lower short-term highs on either side of it, a medium-term low is a short-term low with higher short-term lows on either side of it. Long-term extremes are determined by the same principle, depending on the nearest medium-term highs and lows. Inside bars with a lower high and a lower low than that of the previous bar are not taken into account during the analysis. Thus, the short-term extremes are determined with a delay of at least one bar.
Using the indicator for technical analysis of the market
The position of an instrument's price relative to the indicator lines, as well as the position of the indicator lines relative to each other, gives an idea of the trend development, allows you to quickly find the support and resistance levels, determine the potential for the price to grow (fall) by long-term highs and lows. This indicator will be useful for creating automatic trading systems, as it allows you to quickly determine the trend direction programmatically.
Rebound of the price from a high or a low is a confirmation of a support or a resistance level presence and serves as a signal for opening deals at the next breakout or a rebound from this level. You can find additional information on entry signals in the book by Larry Williams.
The indicator does not redraw the lines once they are broken and does not reposition the medium-term and long-term highs (lows). If a short-term high (low) turns out to be higher (lower), it is possible to determine the trend based on the position of the indicator lines relative to each other. In some cases, when an outside bar is formed, the short0term low may be higher than the short-term high. This is not an error in the indicator logic, ad can serve as an entry point to a short or long position (see Figure 1). This principle is used in signals of the first type in the SRVector indicator.
Parameters
- Show short-term extremes - show the short-term levels;
- Show medium-term extremes - show the medium-term levels;
- Show long-term extremes - show the long-term levels;
- Prices for building extremes - plot the levels based on high and low prices, or based on open and close prices of the bars.
安全须知
本产品仅通过 MQL5.com 官方渠道获取。其他渠道版本可能缺少完整功能和技术支持。
EA 配置
| 交易品种 | XAUUSD |
| 时间框架 | H1 (推荐) |
| 推荐经纪商 | IC Markets, IC Trading |
| 最低存款 | $300 / 0.01手 |
📸 截图预览