📝 产品详情
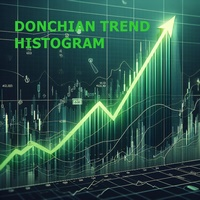
Donchian Trend Histogram
| 作者 | Mariusz Piotr Rodacki |
| 版本 | v1.0 |
| 激活数 | 0 |
Donchian channels are a tool in technical analysis used to determine the relative volatility of a market and the potential for price breakouts.
Can help identify potential breakouts and reversals in price, which are the moments when traders are called on to make strategic decisions. These strategies can help you capitalize on price trends while having pre-defined entry and exit points to secure gains or limit losses. Using the Donchian channel can thus be part of a disciplined approach to managing trades.
When the price breaks above the upper Donchian channel, the indicator is green. When the price falls below the lower Donchian channel, the indicator will be red.
Take a look at my other trend indicators as well.
安全须知
本产品仅通过 MQL5.com 官方渠道获取。其他渠道版本可能缺少完整功能和技术支持。
EA 配置
| 交易品种 | XAUUSD |
| 时间框架 | H1 (推荐) |
| 推荐经纪商 | IC Markets, IC Trading |
| 最低存款 | $300 / 0.01手 |
📸 截图预览