📝 产品详情
Master Hedging Indicator 2Symbols
| 作者 | Mohamed yehia Osman |
| 版本 | v188 |
| 更新 | 17 七月 2020 |
| 激活数 | 5 |
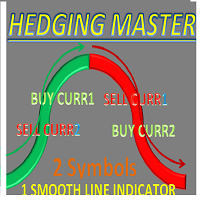
HEDGING MASTER line indicator
It compares the power/strength lines of two user input symbols and create a SMOOTHED line that indicates the degree of deviation of the 2 symbols
Strategy#1- FOLLOW THE INDICATOR THICK LINE when CROSSING O LEVEL DOWN --- TRADE ON INDICATOR THICK LINE (TREND FRIENDLY) !!
Strategy#2- TRADE INDICATOR PEAKS (Follow indicator Reversal PEAKS Levels)!!
you input - the index of calculation ( 10/20/30....)
- the indicator Drawing start point (indicator history drawn in bars)
- the two symbols to compare ( carefully input your Symbols as format could differ between different brokers)
- list of symbols used to generate a proposed two deviated currencies pair to use in hedging as your 2 input symbols for better hedging results
Works on any TIMEFRAME
:::: carefully input your Symbols as format could differ between different brokers
proposed 2 currencies pair labels appear on main chart window to use it in your input set
FOLLOW THE INDICATOR THICK LINE --- TRADE ON INDICATOR THICK LINE !!
if INDICATOR line goes down (RED THICK LINE : WITH THE TREND && Line crosses level 0 ) indicates Symbol2 is taking power over symbol1 ==> SELL SYMBOL1 + BUY SYMBOL2
if INDICATOR line goes up (GREEN thin LINE : Against THE TREND ) ==> CLOSE SELL SYMBOL1 and CLOSE BUY SYMBOL2
if INDICATOR line goes up (GREEN THICK WITH THE TREND && Line crosses level 0 ) indicates Symbol1 is taking power over symbol2==> BUY SYMBOL1 + SELL SYMBOL2
if INDICATOR line goes down (RED thin LINE : Against THE TREND ) ==> CLOSE BUY SYMBOL1 and CLOSE SELL SYMBOL2
::::I don't recommend working on thin line (Against the TREND)
OR TRADE INDICATOR PEAKS :
- Find peak Levels on indicator waves and trade on reversal Symbols1 vs Symbol2 (example shown in screeshots attached)
Strategy #3: Daily trade on thick lines :
A- Red (green) thick line appears after green (red) thin line : Alert enabled to Sell (buy) Symbol1 and Buy (sell)Symbol2
B - during the day another Red (green) thick line appears after green (red) thin line : Alert enabled to Sell (buy) Symbol1 and Buy (sell) Symbol2 -Add same lot new positions
C-At the end of the day : Check if total positions are profited ( you can set your profit relative to your margin used ) : Close your positions for today
D-At the end of the day : Check if total positions are not profited ( you can set your profit relative to your margin used ) :
repeat Step A-D fro next day
F- If thick lines reverse to Green (red) : you start adding 2 new positions in different directions (Buy (sell) Symbol1 and Sell (buy) Symbol2) and close two positions from old trend
and repeat A-F
ALERTS for crossing level 0 or peak reversal are provided
TRY THE DEMO BEFORE ANY PURSHASE !!
安全须知
本产品仅通过 MQL5.com 官方渠道获取。其他渠道版本可能缺少完整功能和技术支持。
EA 配置
| 交易品种 | XAUUSD |
| 时间框架 | H1 (推荐) |
| 推荐经纪商 | IC Markets, IC Trading |
| 最低存款 | $300 / 0.01手 |
📸 截图预览