📝 产品详情
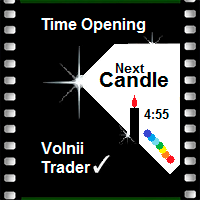
Opening Candle Time
| 作者 | Alexander Shienkov |
| 版本 | v2.0 |
| 更新 | 2018-04-25T15:20:58 |
| 激活数 | 0 |
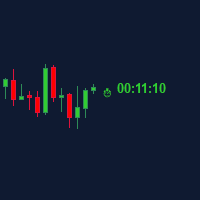
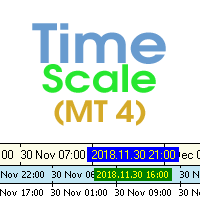
A simple information indicator showing the time left before the opening of the next candlestick or bar.
About the concept of a timeframe
A timeframe is the time interval considered in the technical analysis of free financial markets (the same applies to the global currency market), during which the price and other market data change. The smallest timeframe is the so-called tick.
A timeframe is the time interval used to group quotes when drawing elements of a price chart (bars, Japanese candlesticks, line chart).
Indicator operation
Any trader knows how important the candlestick opening and closing prices are. For example, closing of a H1 candlestick above the technical level added by the trader indicates a possible continuation of an uptrend. Closing below it points to a possible continuation of a downtrend. This indicator allows tracking how much time is left before the closing and opening of a candlestick or a bar based on arithmetic calculations. In other words, the indicator saves the trader's time and makes the work more comfortable.
The digits showing the remaining time are updated at every tick.
The fixed location of the time information:
- a small indent to the right of a currently forming candlestick
- right below the current Bid price
Indicator Input Parameters
- Text color – the default color is Blue.
- Text size – the default text size is 10.
Note: the indicator can be used with any chart background color.
安全须知
本产品仅通过 MQL5.com 官方渠道获取。其他渠道版本可能缺少完整功能和技术支持。
EA 配置
| 交易品种 | XAUUSD |
| 时间框架 | H1 (推荐) |
| 推荐经纪商 | IC Markets, IC Trading |
| 最低存款 | $300 / 0.01手 |
📸 截图预览