Candle High Low Exit
| 作者 | BLAKE STEVEN RODGER |
| 版本 | v1.7 |
| 更新 | 2020-10-07T18:10:24 |
| 激活数 | 0 |
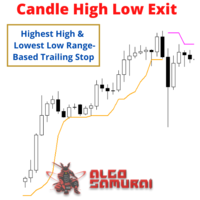
The Candle High Low Exit indicator uses the highest high and the lowest low of a range to draw trailing stop lines (orange under buys, magenta over sells) that advance with the trend until the trend changes direction. Moreover, the trailing stop lines are generated to support the order’s trend direction (long or short):
- In an upward trend, the long trailing stop line (orange line under buy) appears and advances upward until the close crosses under the line.
- In a downward trend, the short trailing stop line (magenta over sell) appears and declines until the close crosses over the line.
Parameters
- Candles (3) — The number of candles for the calculation
- Show Channel (true/false) — if false (default), it shows the orange line under buy in upward trend, magenta line over sell in downward trend; if true, it shows a channel on both sides of the price.