📝 产品详情
Break Lines
| 作者 | Alexander Nikolaev |
| 版本 | v1.2 |
| 更新 | 2016-04-12T15:42:03 |
| 激活数 | 0 |
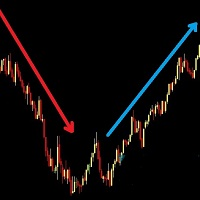
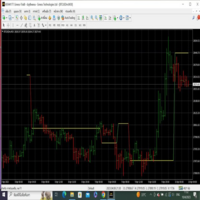
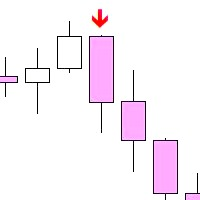
The indicator draws lines the the price highs and lows. Break through the high or low usually indicates trend change (or continuation). Once the price moves through a line, and the candlestick closes, the indicator draws an appropriate arrow (also, you can enable alerts). A deal should be conducted in the breakthrough direction immediately or after a slight rollback. It is best to trade following the trend on a larger timeframe. This indicator is easy to use, but nevertheless, there are many trading strategies, which are based on a breakthrough of the trading range.
The number of candlesticks used to determine the high and low of the trading range can be adjusted.
The following Expert Advisors are based on this indicator: Breakout Line and Breakout and pullback
Parameters
- Trading range - number of bars of the trading range used to define highs and lows;
- Shift - shift relative to the trade range to determine the breakthrough;
- EnableAlert - enable/disable alerts (true - on).
安全须知
本产品仅通过 MQL5.com 官方渠道获取。其他渠道版本可能缺少完整功能和技术支持。
EA 配置
| 交易品种 | XAUUSD |
| 时间框架 | H1 (推荐) |
| 推荐经纪商 | IC Markets, IC Trading |
| 最低存款 | $300 / 0.01手 |
📸 截图预览