📝 产品详情
Beacon
| 作者 | Pavel Shutovskiy |
| 版本 | v1.10 |
| 更新 | 2015-02-11T13:41:57 |
| 激活数 | 0 |
The indicator determines overbought/oversold zones on various timeframes.
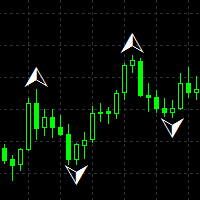
Arrows show market trend in various time sessions: if the market leaves the overbought zone, the arrow will indicate an ascending trend (arrow up), if the market leaves the oversold zone, the arrow will indicate a descending trend (arrow down).
Situation on the timeframe, where the indicator is located, is displayed in the lower right window. Information on the market location (overbought or oversold zone), as well as the trend (bullish or bearish) is specified in the window.
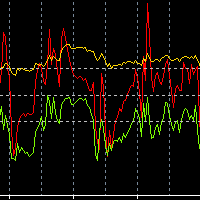
The left window displays prospects of the market and analyses all timeframes. Probability of ascending or descending trend is determined on the basis of these data.
The indicator is adapted for different trading symbols.
Parameters:
- X distance - Distance of X coordinate in pixels
- Y distance - Distance of Y coordinate in pixels
安全须知
本产品仅通过 MQL5.com 官方渠道获取。其他渠道版本可能缺少完整功能和技术支持。
EA 配置
| 交易品种 | XAUUSD |
| 时间框架 | H1 (推荐) |
| 推荐经纪商 | IC Markets, IC Trading |
| 最低存款 | $300 / 0.01手 |
📸 截图预览