📝 产品详情
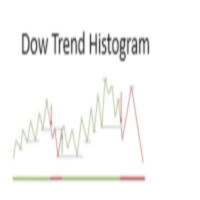
Dow Histogram v1
| 作者 | Mariusz Piotr Rodacki |
| 版本 | v2.0 |
| 更新 | 1 一月 2024 |
| 激活数 | 0 |
You've probably heard about the Dow trend Theory, where higher highs and lows indicate an uptrend, and lower highs and lows indicate a downtrend. This indicator determines this trend based on the Dow Theory. You just need to enter a number representing the number of candles between extremes. The optimal solution is the number 3, unless you want to have the trend from M5 but you're on M1, then you need to multiply this number by 5.
Check various combinations to trade with the trend.
In the screenshots, you can see the "Dow trend band" indicator, which shows how the "Dow histogram" identifies extremes.
Dow trend bands you can dawnoload here: https://www.mql5.com/en/market/product/109778?source=Unknown
Additionally :
-Ignore first breakout
-Sound alert on trend change.
-Alert Notification
-Alert Notification on your mobile phone
安全须知
本产品仅通过 MQL5.com 官方渠道获取。其他渠道版本可能缺少完整功能和技术支持。
EA 配置
| 交易品种 | XAUUSD |
| 时间框架 | H1 (推荐) |
| 推荐经纪商 | IC Markets, IC Trading |
| 最低存款 | $300 / 0.01手 |
📸 截图预览