📝 产品详情
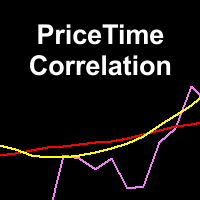
Price Time Correlation
| 作者 | Muhammad Robith |
| 版本 | v1.13 |
| 更新 | 2019-01-18T18:04:06 |
| 激活数 | 0 |
This indicator determine price volatility using correlation between Price and Time.
WARNING: Not suitable for 1M timeframe, you would not see any lines in this frame!
How to Use:
- More closer the indicator's value to 0, the price is considered more volatile.
- When reversal is started, the indicator's value would be rise or fall significantly.
- During a strong trend, the indicator's value would be closer to 1 or -1, depends on current trend.
Entry Signal:
- BUY SIGNAL: Indicator crosses 0.2 from below. This value can be changed, as long as it more than 0.
- SELL SIGNAL: Indicator crosses -0.2 from above. This value can be changed, as long as it less than 0.
Input Description:
- period: Determine how many bars used to determine price's volatility. 6 is recommended.
- applied_price: Prices to be applied to the indicator. Use 1 of these integers to use it: 0 -> Close Price, 1 -> Open, 2 -> High, 3 -> Low, 4 -> Median, 5 -> Typical, 6 -> Weighted Typical
安全须知
本产品仅通过 MQL5.com 官方渠道获取。其他渠道版本可能缺少完整功能和技术支持。
EA 配置
| 交易品种 | XAUUSD |
| 时间框架 | H1 (推荐) |
| 推荐经纪商 | IC Markets, IC Trading |
| 最低存款 | $300 / 0.01手 |
📸 截图预览