📝 产品详情
Dynamic Swing Anchored Bollinger Bands
| 作者 | Minh Truong Pham |
| 版本 | v8 |
| 激活数 | 5 |
| 原价 | $59 USD |
Dynamic Swing Anchored Bollinger Bands (Swing Point Based)
Overview
Dynamic Swing Anchored Bollinger Bands is a technical analysis tool that combines swing point price structure with Bollinger Bands to create a flexible, adaptive average price zone. Instead of relying on VWAP (volume-weighted average price), this indicator anchors the calculation at Swing High/Low points and uses re-initialized Bollinger Bands that adapt to current market volatility, providing highly relevant support/resistance levels.
How It Works
1. Swing Anchor Engine
-
The indicator identifies swing highs and swing lows based on the SwingPeriod parameter.
-
When a market reversal is confirmed (pivot formation), the Bollinger Bands are re-anchored from that pivot — creating a new starting point for the average calculation.
2. Adaptive Bollinger Bands Core
-
At each swing anchor, Bollinger Bands are recalculated based on time elapsed since the anchor.
-
The band width is dynamically adjusted using volatility metrics (such as ATR or short-term standard deviation compared to long-term average):
-
High volatility → bands expand faster, matching the current market conditions.
-
Low volatility → bands respond more slowly, smoothing out noise.
-
Why It’s More Effective Than Standard Bollinger Bands
-
Anchoring improves relevance: By anchoring to swing points, the bands remain aligned with recent price action, unlike standard Bollinger Bands that may lag during prolonged trends.
-
Better adaptability: Dynamic adjustment to volatility ensures more accurate support/resistance zones and reduces false signals in both trending and ranging markets.
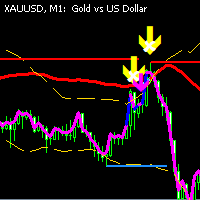
How to Use (Figure 2 and 3)
-
Swing-Based Fair Value
-
The anchored mean line acts as a fair-value zone. Pullbacks to the middle band or approaches to the upper/lower band can signal entries either in trend continuation or mean-reversion trades.
-
-
Trend Trading
-
In strong trends, price often “rides” along the mean or outer bands. Shallow pullbacks to the mean can be opportunities to enter in the trend direction.
-
-
Retest & Reversal
-
If price touches or pierces the outer bands (Upper/Lower) and confirms with reversal signals (e.g., candlestick patterns, divergence), it may indicate a reversal or strong reaction.
-
Key Settings
Feature Description
- Swing Period Number of bars used to confirm swing highs/lows. Larger values → stronger pivots/less noise; smaller values → faster reaction but more noise.
- Length (Mean Period) Number of bars used to calculate the mean line.
- Deviation Number of standard deviations or ATR multiplier used to calculate the bands.
- Volatility Adjustment Enables/disables dynamic adjustment of band width based on volatility (e.g., ATR vs ATR average).
- Bias (Sensitivity) Controls how strongly volatility impacts band width.
Conclusion
Dynamic Swing Anchored Bollinger Bands is a versatile tool that merges swing point structure with the adaptability of Bollinger Bands. By anchoring bands to swing highs/lows, it keeps calculations relevant, improves the accuracy of pullback detection, identifies reliable reversals, and adapts seamlessly to different market conditions — from trending to ranging phases.
安全须知
本产品仅通过 MQL5.com 官方渠道获取。其他渠道版本可能缺少完整功能和技术支持。
EA 配置
| 交易品种 | XAUUSD |
| 时间框架 | H1 (推荐) |
| 推荐经纪商 | IC Markets, IC Trading |
| 最低存款 | $300 / 0.01手 |
📸 截图预览