📝 产品详情
Resistance Support Levels
| 作者 | Heiko Kendziorra |
| 版本 | v1.1 |
| 激活数 | 63550 |
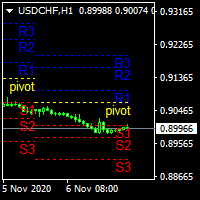
The indicator shows support and resistance levels as horizontal lines. It shows the highs and lows of former days, weeks and month in every chart.
How to work with support and resistance levels show the EA Limit Scalper and the Universal Moving Average Expert Advisor (UniMA EA).
When the tip of the coursor is on a line (mouseover) it shows the real value of the level and which high or low is shown, see explanation below.
The indicator must be installed like an expert advisor! To see levels of former days you have to make a backtest and then open the chart.
Note that the indicator shows first wrong levels if the values are not saved already and have to be downloaded automaticly. In the second try it shows the correct levels.
Mouseover legend:
hhd1 = highest high of day 1 (day before today)
lld1 = lowest low of day 1
hhd2 = highest high of day 2 (day before yesterday)
lld2 = lowest low of day 2
...
until day 5
hhw1 = highest high of week 1 (last week)
llw1 = lowest low of week 1
...
until week 5
hhm1 = highest high of month 1 (last month)
llm1 = lowest low of month 1
...
until month 6
The colors of the lines can be changed in the settings.
安全须知
本产品仅通过 MQL5.com 官方渠道获取。其他渠道版本可能缺少完整功能和技术支持。
EA 配置
| 交易品种 | XAUUSD |
| 时间框架 | H1 (推荐) |
| 推荐经纪商 | IC Markets, IC Trading |
| 最低存款 | $300 / 0.01手 |
📸 截图预览