📝 产品详情
Daily Volatility Tracker
| 作者 | Suvashish Halder |
| 版本 | v1.0 |
| 激活数 | 0 |
Daily Volatility Tracker is a practical and lightweight indicator designed to help traders monitor and analyze market volatility based on historical daily price movements.
Whether you're a day trader, swing trader, or scalper, understanding how much a market moves per day is critical for:
- Choosing the right pairs to trade
- Setting accurate stop-loss and take-profit levels
- Adapting to changing market conditions
What This Indicator Does
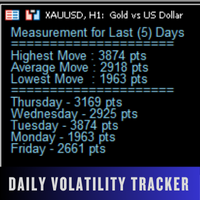
This tool calculates and displays the daily range (High - Low) of price movements for the most recent trading days.
It gives you clear insights into:
- The highest movement among the selected days
- The lowest movement
- The average daily range in points
- A daily breakdown with day initials (e.g. Monday - 254 points, Tuesday - 310 points, etc.)
Everything is presented cleanly on your chart using a label system that works well with both light and dark themes.
How the “Last 5 Days” Are Counted
- Automatically skips weekends (Saturday and Sunday)
- Uses the most recent valid trading days (Monday through Friday)
- Includes today if it’s a weekday
- For example, if today is Monday, it includes:
- Monday (today)
- Friday
- Thursday
- Wednesday
- Tuesday
This ensures the volatility data is accurate and relevant to current trading conditions.
Main Features
- Displays key volatility stats directly on your chart
- Counts only valid trading days
- Customizable font size and color
- Clean, multi-line label system for easy reading
- Works on any timeframe (uses Daily candles for calculation)
How to Use It
- Attach the indicator to any chart
- Set how many past days to measure (default: 5)
- Instantly view:
- Highest, average, and lowest point ranges
- Daily movement per day (e.g. M - 254 pts)
Use this data to:
- Compare volatility across different symbols
- Identify high-volatility pairs to trade
- Avoid low-activity or flat market conditions
Who It’s For
- Traders who want quick visual insight into recent market activity
- Those looking to identify the most volatile currency pairs
- Traders who rely on volatility-based strategies or setups
Daily Volatility Tracker helps you understand what the market is actually doing, so you can trade smarter with real volatility insight.
安全须知
本产品仅通过 MQL5.com 官方渠道获取。其他渠道版本可能缺少完整功能和技术支持。
EA 配置
| 交易品种 | XAUUSD |
| 时间框架 | H1 (推荐) |
| 推荐经纪商 | IC Markets, IC Trading |
| 最低存款 | $300 / 0.01手 |
📸 截图预览