📝 产品详情
LineBreakMT4
| 作者 | Nattadecha Tangpakinwat |
| 版本 | v1.0 |
| 激活数 | 0 |
Key Features:
- Type of Indicator: Line Break Chart Indicator
- Usage: Identifying trend reversals and potential market turning points.
- Input Parameters: The primary input parameter is 'Lines_Break,' which represents the number of lines the price needs to move to create a new line in the opposite direction.
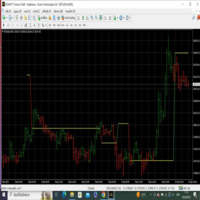
How it works: The indicator draws green and red histogram bars to represent the line break chart. Green bars indicate an upward trend, and red bars indicate a downward trend. The indicator calculates the highest high and lowest low of the specified number of lines break and compares them with the current high and low. If the current high is greater than the highest high of the specified lines break, the trend is considered bullish. If the current low is lower than the lowest low of the specified lines break, the trend is considered bearish.
Usage: Traders can use the LineBreakMT4 indicator to identify potential trend reversals and market turning points. When the histogram changes color from red to green, it signals a potential trend reversal to the upside, and traders might consider entering a long position. Conversely, when the histogram changes color from green to red, it signals a potential trend reversal to the downside, and traders might consider entering a short position.
You can find the following indicator by the following linkage.
https://www.mql5.com/en/market/product/96399?source=Site+Profile
This Free indicator must used with the ZigZag TrendLine MT4 Indicator to find the accurate result.
As explained in the graphic in the second ther is five point circled
green represented +ve
red represented -ve
- if green line is above or below or just cut the red histogram that means downtrends +ve and -ve becomes -ve.
- if green line is above or below or just cut the green histogram that means uptrends +ve and +ve becomes +ve.
- if red line is above or below or just cut the green histogram that means downtrends -ve and +ve becomes -ve.
- if red line is above or below or just cut the red histogram that means uptrends -ve and -ve becomes +ve.
- if the red or green is in between the histogram that mean horizontal trend. Wait and See.
安全须知
本产品仅通过 MQL5.com 官方渠道获取。其他渠道版本可能缺少完整功能和技术支持。
EA 配置
| 交易品种 | XAUUSD |
| 时间框架 | H1 (推荐) |
| 推荐经纪商 | IC Markets, IC Trading |
| 最低存款 | $300 / 0.01手 |
📸 截图预览