📝 产品详情
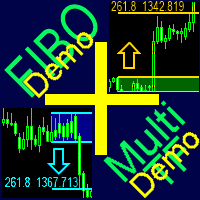
FiboPlusMultiTFDemo
| 作者 | Sergey Malysh |
| 版本 | v1.0 |
| 更新 | 2018-05-04T16:14:17 |
| 激活数 | 63550 |
A ready-made multitimeframe trading system based on automatic plotting and tracking of Fibonacci levels for buying and selling any symbol.
Demo version - calculation of the last 390 bars is not performed.
Advantages
- Determines the trend direction based on a complex of 14 indicators (Cx), extremums of ZigZag (Z), RSI (R), Impulse (I)
- Displaying the values of 14 indicators comprising the trend direction (Cx)
- Plotting horizontal levels, support and resistance lines, channels
- View the plotting option of Fibonacci levels on any timeframe, with the ability to scroll into the chart history. Not dependent on the working timeframe:
- Standard - standard plot
- RSI - the Relative Strength Index indicator
- System of alerts for all timeframes
- On-screen
- Push notifications
Buttons
- Changing the color scheme
- «Arrows». Move the menu to an arbitrary place.
- «X». Remove the indicator from the chart.
"Trend direction". Calculate the trend direction on each timeframe. Used indicators: RSI, Stochastic, MACD, ADX, BearsPower, BullsPower, AO, WPR, MA - 5,10,20,50,100,200.
- "Auto", "Manual" setting of the trend direction
- "Timeframes M1, M5,..." - press the button to see the indicator values for the selected timeframe
- "Value Trend direction". Values of indicators comprising the trend direction.
- "ZigZag (Z) RSI (R) Impulse (I)" trend based on extremums of these indicators
"Support & Resistance".
- "Horizontal line" plot horizontal levels (fractals and RSI)
"Trend line" plot trend lines (RSI)
- "SUP" support
- "RES" resistance
"Chanel" plot channels
- "SUP" support
- "RES" resistance
"Fibonacci levels"
- "Timeframes M1, M5,..."
- debt of flow, Best, Standard, RSI, Impulse, Zig_Zag - select the plotting option for Fibonacci levels
- View the selected Fibonacci level in history:
- |< first
- < previous
- > next
- >| last
- "Alert signal & Trading". Current trading signals
- "Show your Fibo level" show the working Fibonacci levels with the custom level
Parameters
- Language (Russian, English, Deutsch, Espanol, Portugues)
- Color scheme - color scheme (preset colors):
- White background - for a white background
- Black background - for a black background
- Custom background - custom settings of all colors
- FIBO Custom - level values separated by «,»
- User Fibo level - custom Fibonacci level
- Alert on/off - enable/disable alerts
- Alert from Time Frame, Alert to Time Frame - timeframes for alerts
- Minute repeat of Alerts - the number of minutes to repeat alerts
- Number repeat of Alerts - the number of alert repetitions
- Alert Fibo only - alerts only at Fibonacci retracement levels
- E-Mail on/off - send alerts to E-Mail
- Push on/off - send alerts via Push notifications
- custom color settings:
- BUY - color Fibonacci levels UP, BUY - color Rectangle, BUY - color text
- SELL - color Fibonacci levels DOWN, SELL - color Rectangle, SELL - color text
- Resistance line - color, Support line - color
- Divergence line - color, color text in the button
- Font settings
- Font Name - font name
- Font Size 8, 10, 12, 14 - font size
Trading system
- Sell. Candle closes below level 100, stop loss exceeds 76.4, take profit minimum 161.8, take profit 1 (261.8), take profit 2 (423.6)
- Buy. Candle closes above level 100, stop loss is below level 76.4, take profit minimum 161.8, take profit 1 (261.8), take profit 2 (423.6)
- Buy/sell in a rectangle area limited by level 0-100. Trading is performed from one level to another (no trend).
- Earlier market entry. Enter on the next calculation after a new Fibonacci calculation is formed, stop loss -23,6 (minus 23,6) or beyond a horizontal level
- "Debt of flow" option. FiboPlusChart plots the Market Maker's "debt of flow" levels, the price is likely to return to these levels. Trade from level 100 to take profit 1 - 50, take profit 2 - 33. The second option is to place pending limit orders at levels 50% and 33% along the trend
安全须知
本产品仅通过 MQL5.com 官方渠道获取。其他渠道版本可能缺少完整功能和技术支持。
EA 配置
| 交易品种 | XAUUSD |
| 时间框架 | H1 (推荐) |
| 推荐经纪商 | IC Markets, IC Trading |
| 最低存款 | $300 / 0.01手 |
📸 截图预览