📝 产品详情
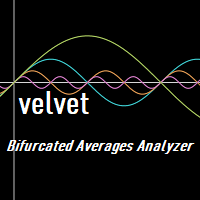
Bifurcated Averages Analyzer
| 作者 | Kevin Peter Abate |
| 版本 | v1.1 |
| 更新 | 2021-09-06T04:55:00 |
| 激活数 | 0 |
a novel indicator by the maker of velvet.
This indicator analyzes the differences between moving averages with averaging periods that increase exponentially to detect the direction of a trend and the volatility within that trend. The histogram displays the standard deviation and the position of the line versus time indicates the mean value of the differences between each subsequent averaging period. So the line indicates the degree of expectation for an equilibrium process to occur, so this is an indicator of bearishness, where negative values for the mean value of the differences indicate bullish expectations. The histogram, then is a measure of volatility within a trend.
The indicator will also reveal the parameters used to generate the graph via the indicator's short name using the Velvet compatibility protocol.
Acknowledgements:
Desmos Graphing Calculator (used to make the logo)
Combinatorics and Probability Theory for Trading (Part I): The Basics. (The explanations of some very advanced maths are clear and down to Earth here, even translated from Russian.)
安全须知
本产品仅通过 MQL5.com 官方渠道获取。其他渠道版本可能缺少完整功能和技术支持。
EA 配置
| 交易品种 | XAUUSD |
| 时间框架 | H1 (推荐) |
| 推荐经纪商 | IC Markets, IC Trading |
| 最低存款 | $300 / 0.01手 |
📸 截图预览